
Page 90 - IJPS-1-1
P. 90
A simulation analysis of the longer-term effects of immigration on per capita income in an aging population
Referring back to Section 2.2, the total population in generation 1 can be obtained from
Equation (2) as
)
′
N = ' un = ' un + ( q u Qn (5)
0
1
1
0
where u is again a vector of ones. Let b 1 be the vector of age-sex proportions of the overall
population in generation 1 (corresponding to α , the age-sex proportions vector for immi-
grants). We may then write
′
′
n = N b = (u Qn + ( q u Qn 0 )) 1 (6)
b
1
11
0
( )
′
The immigration total is M = ( q u Qn 0 )α . Letting diag α and diag ()b be diagon-
1
1
al matrices in which α and b 1 are the diagonals, we write
)
)
′
H = ( (q u Qn diag ( )) (u Qnα ′ 0 + ( q u Qn diag ( ))b 1 − 1
′
0
0
(7)
= (q ( /1 q ))diag ( )diagα ( )b 1 − 1
+
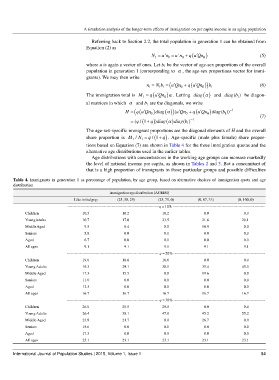
The age-sex-specific immigrant proportions are the diagonal elements of H and the overall
share proportion is M 1 / N = q ( /1 q+ ) . Age-specific (male plus female) share propor-
1
tions based on Equation (7) are shown in Table 4 for the three immigration quotas and the
alternative age distributions used in the earlier tables.
Age distributions with concentrations in the working age groups can increase markedly
the level of national income per capita, as shown in Tables 2 and 3. But a concomitant of
that is a high proportion of immigrants in those particular groups and possible difficulties
Table 4. Immigrants in generation 1 as percentage of population, by age group, based on alternative choices of immigration quota and age
distribution
Immigration age distribution (AGEIM)
Like initial pop. (25, 50, 25) (25, 75, 0) (0, 67, 33) (0, 100, 0)
----------------------------------------------------------------------q = 10% ----------------------------------------------------------------------
Children 10.5 10.2 10.2 0.0 0.0
Young Adults 10.7 17.0 23.5 21.6 29.1
Middle Aged 9.5 8.4 0.0 10.9 0.0
Seniors 5.8 0.0 0.0 0.0 0.0
Aged 6.7 0.0 0.0 0.0 0.0
All ages 9.1 9.1 9.1 9.1 9.1
---------------------------------------------------------------------- q = 20% ----------------------------------------------------------------------
Children 19.0 18.6 18.6 0.0 0.0
Young Adults 19.3 29.1 38.1 35.4 45.0
Middle Aged 17.3 15.5 0.0 19.6 0.0
Seniors 11.0 0.0 0.0 0.0 0.0
Aged 12.5 0.0 0.0 0.0 0.0
All ages 16.7 16.7 16.7 16.7 16.7
---------------------------------------------------------------------- q = 30% ----------------------------------------------------------------------
Children 26.0 25.5 25.5 0.0 0.0
Young Adults 26.4 38.1 47.9 45.2 55.2
Middle Aged 23.8 21.7 0.0 26.7 0.0
Seniors 15.6 0.0 0.0 0.0 0.0
Aged 17.3 0.0 0.0 0.0 0.0
All ages 23.1 23.1 23.1 23.1 23.1
International Journal of Population Studies | 2015, Volume 1, Issue 1 84