
Page 89 - IJPS-1-1
P. 89
Frank T. Denton and Byron G. Spencer
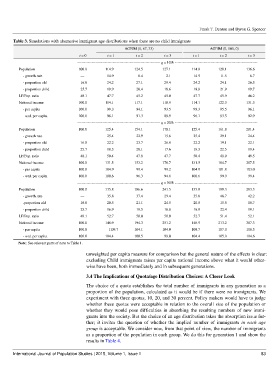
Table 3. Simulations with alternative immigrant age distributions when there are no child immigrants
AGEIM (0, 67, 33) AGEIM (0, 100, 0)
t = 0 t = 1 t = 2 t = 3 t = 1 t = 2 t = 3
--------------------------------------------------------------- q = 10% ---------------------------------------------------------------
Population 100.0 114.9 124.5 127.1 114.9 128.1 136.6
- growth rate — 14.9 8.4 2.1 14.9 11.5 6.7
- proportion old 16.8 24.2 27.1 29.4 24.2 24.1 26.5
- proportion child 25.7 19.9 20.4 18.6 19.9 21.9 19.7
LF/Pop. ratio 48.1 47.7 45.2 45.0 47.7 45.9 46.2
National income 100.0 114.1 117.1 118.9 114.1 122.3 131.3
- per capita 100.0 99.3 94.1 93.5 99.3 95.5 96.1
- wtd. per capita 100.0 96.1 91.3 89.9 96.1 93.5 92.9
--------------------------------------------------------------- q = 20% ---------------------------------------------------------------
Population 100.0 125.4 154.1 178.1 125.4 161.8 201.4
- growth rate — 25.4 22.9 15.6 25.4 29.1 24.4
- proportion old 16.8 22.2 23.7 26.8 22.2 19.1 22.1
- proportion child 25.7 18.3 20.1 17.6 18.3 22.5 19.4
LF/Pop. ratio 48.1 50.4 47.8 47.7 50.4 48.9 49.5
National income 100.0 131.5 153.2 176.7 131.5 164.7 207.5
- per capita 100.0 104.9 99.4 99.2 104.9 101.8 103.0
- wtd. per capita 100.0 100.6 96.3 94.8 100.6 99.9 99.4
--------------------------------------------------------------- q = 30% ---------------------------------------------------------------
Population 100.0 135.8 186.6 241.5 135.8 199.3 283.3
- growth rate — 35.8 37.4 29.4 35.8 46.7 42.2
-proportion old 16.8 20.5 21.1 24.5 20.5 15.5 18.7
- proportion child 25.7 16.9 19.5 16.8 16.9 22.4 19.1
LF/Pop. ratio 48.1 52.7 50.0 50.0 52.7 51.4 52.1
National income 100.0 148.9 194.3 251.2 148.9 213.2 307.3
- per capita 100.0 1O9.7 104.1 104.0 109.7 107.0 108.5
- wtd. per capita 100.0 104.4 100.5 99.0 104.4 105.0 104.6
Note: See relevant parts of note to Table 1.
unweighted per capita measure for comparison but the general nature of the effects is clear:
excluding Child immigrants raises per capita national income above what it would other-
wise have been, both immediately and in subsequent generations.
3.4 The Implications of Quota/age Distribution Choices: A Closer Look
The choice of a quota establishes the total number of immigrants in any generation as a
proportion of the population, calculated as it would be if there were no immigrants. We
experiment with three quotas, 10, 20, and 30 percent. Policy makers would have to judge
whether these quotas were acceptable in relation to the overall size of the population or
whether they would pose difficulties in absorbing the resulting numbers of new immi-
grants into the society. But the choice of an age distribution takes the absorption issue fur-
ther; it invites the question of whether the implied number of immigrants in each age
group is acceptable. We consider now, from that point of view, the number of immigrants
as a proportion of the population in each group. We do this for generation 1 and show the
results in Table 4.
International Journal of Population Studies | 2015, Volume 1, Issue 1 83