
Page 86 - IJPS-1-1
P. 86
A simulation analysis of the longer-term effects of immigration on per capita income in an aging population
distributed as 25 percent Children, 50 percent Young Adults, and 25 percent Middle Aged.
3. Results
3.1 Initial Simulations
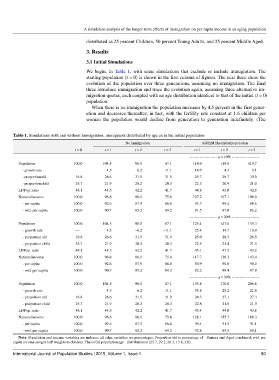
We begin, in Table 1, with some simulations that exclude or include immigration. The
starting population (t = 0) is shown in the first column of figures. The next three show the
evolution of the population over three generations, assuming no immigration. The final
three introduce immigration and trace the evolution again, assuming three alternative im-
migration quotas, each coupled with an age distribution identical to that of the initial (t = 0)
population.
When there is no immigration the population increases by 4.5 percent in the first gener-
ation and decreases thereafter; in fact, with the fertility rate constant at 1.6 children per
woman the population would decline from generation to generation indefinitely. (The
Table 1. Simulations with and without immigration; immigrants distributed by age as in the initial population
No immigration AGEIM like initial population
t = 0 t = 1 t = 2 t = 3 t = 1 t = 2 t = 3
--------------------- q = 10% ---------------------
Population 100.0 104.5 98.0 87.1 114.9 119.8 119.7
- growth rate — 4.5 –6.2 –11.1 14.9 4.3 –0.1
- proportion old 16.8 26.6 31.5 31.9 25.7 29.7 30.0
- proportion child 25.7 21.9 20.2 20.3 22.3 20.9 21.0
LF/Pop. ratio 48.1 44.5 42.2 41.7 44.8 43.0 42.6
National income 100.0 96.8 86.1 75.6 107.2 107.1 106.0
- per capita 100.0 92.6 87.9 86.8 93.3 89.4 88.6
- wtd. per capita 100.0 90.7 85.2 84.2 91.5 87.0 86.2
--------------------- q = 20% ---------------------
Population 100.0 104.5 98.0 87.1 125.4 143.8 159.3
- growth rate — 4.5 –6.2 –11.1 25.4 14.7 10.8
- proportion old 16.8 26.6 31.5 31.9 25.0 28.3 28.5
- proportion child 25.7 21.9 20.2 20.3 22.5 21.4 21.5
LF/Pop. ratio 48.1 44.5 42.2 41.7 45.1 43.5 43.2
National income 100.0 96.8 86.1 75.6 117.7 130.3 143.4
- per capita 100.0 92.6 87.9 86.8 93.9 90.6 90.0
- wtd. per capita 100.0 90.7 85.2 84.2 92.2 88.4 87.9
--------------------- q = 30% ---------------------
Population 100.0 104.5 98.0 87.1 135.8 170.0 206.8
- growth rate — 4.5 –6.2 –11.1 35.8 25.2 21.6
- proportion old 16.8 26.6 31.5 31.9 24.3 27.1 27.3
- proportion child 25.7 21.9 20.2 20.3 22.8 21.8 21.9
LF/Pop. ratio 48.1 44.5 42.2 41.7 45.4 44.0 43.8
National income 100.0 96.8 86.1 75.6 128.1 155.7 188.3
- per capita 100.0 92.6 87.9 86.8 94.4 91.5 91.1
- wtd. per capita 100.0 90.7 85.2 84.2 92.8 89.5 89.1
Note: Population and income variables are indexes; all other variables are percentages. Proportion old is percentage of Seniors and Aged combined; wtd. per
capita income assigns half weights to children. The initial population age distribution is (25.7, 29.2, 28.3, 13.8, 3.0).
International Journal of Population Studies | 2015, Volume 1, Issue 1 80