
Page 88 - IJPS-1-1
P. 88
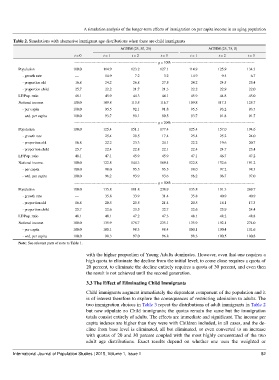
A simulation analysis of the longer-term effects of immigration on per capita income in an aging population

       Table 2. Simulations with alternative immigrant age distributions when there are child immigrants
                                                    AGEIM (25, 50, 25)                    AGEIM (25, 75, 0)
                                 t = 0       t = 1       t = 2        t = 3       t = 1       t = 2        t = 3
                                 --------------------------------------------------------------- q = 10% ---------------------------------------------------------------
         Population             100.0        114.9       123.2       127.1        114.9       125.9       134.3
           - growth rate         —            14.9         7.2         3.2        14.9          9.5         6.7
           - proportion old      16.8         24.2        26.8        27.5        24.2         24.5        25.4
           - proportion child    25.7         22.2        21.7        21.3        22.2         22.9        22.0
         LF/Pop. ratio           48.1         45.9        44.3        44.1        45.9         44.8        45.0
         National income        100.0        109.8       113.5       116.7        109.8       117.3       125.7
           - per capita         100.0         95.5        92.1        91.8        95.5         93.2        93.7
           - wtd. per capita    100.0         93.7        90.1        89.5        93.7         91.8        91.7
                                 --------------------------------------------------------------- q = 20% ---------------------------------------------------------------
         Population             100.0        125.4       151.1       177.4        125.4       157.0       194.6
           - growth rate         —            25.4        20.5        17.4        25.4         25.2        24.0
           - proportion old      16.8         22.2        23.3        24.1        22.2         19.6        20.7
           - proportion child    25.7         22.4        22.8        22.1        22.4         24.7        23.4
         LF/Pop. ratio           48.1         47.1        45.9        45.9        47.1         46.7        47.2
         National income        100.0        122.8       144.3       169.4        122.8       152.6       191.2
           - per capita         100.0         98.0        95.5        95.5        98.0         97.2        98.3
           - wtd. per capita    100.0         96.2        93.9        93.6        96.2         96.7        97.0
                                 --------------------------------------------------------------- q = 30% ---------------------------------------------------------------
         Population             100.0        135.8       181.8       238.9        135.8       191.3       269.7
           - growth rate         —            35.8        33.9        31.4        35.8         40.9        40.9
           - proportion old      16.8         20.5        20.5        21.4        20.5         16.1        17.3
           - proportion child    25.7         22.6        23.5        22.7        22.6         25.9        24.4
         LF/Pop. ratio           48.1         48.1        47.2        47.3        48.1         48.2        48.8
         National income        100.0        135.9       178.7       235.1        135.9       192.1       274.0
           - per capita         100.0        100.1        98.3        98.4        100.1       100.4       101.6
           - wtd. per capita    100.0         98.3        97.0        96.8        98.3        100.5       100.8
         Note: See relevant parts of note to Table 1.

                                      with the higher proportion of Young Adults dominates. However, even that one requires a
                                      high quota to eliminate the decline from the initial level; to come close requires a quota of
                                      20 percent, to eliminate the decline entirely requires a quota of 30 percent, and even then
                                      the result is not achieved until the second generation.
                                      3.3 The Effect of Eliminating Child Immigrants

                                      Child immigrants augment immediately the dependent component of the population and it
                                      is of interest therefore to explore the consequences of restricting admission to adults. The
                                      two immigration choices in Table 3 repeat the distributions of adult immigrants in Table 2
                                      but now stipulate no Child immigrants; the quotas remain the same but the immigration
                                      totals consist entirely of adults. The effects are immediate and significant. The income per
                                      capita indexes are higher than they were with Children included, in all cases, and the de-
                                      cline from base level is eliminated, all but eliminated, or even converted to an increase
                                      with quotas of 20 and 30 percent coupled with the most highly concentrated of the two
                                      adult age  distributions. Exact results  depend on whether one uses the  weighted  or

       International Journal of Population Studies | 2015, Volume 1, Issue 1                                    82