
Page 91 - IJPS-1-1
P. 91
Frank T. Denton and Byron G. Spencer
of absorbing the implied large numbers of newcomers of a given age into the society. The
issue of absorption lies outside our model framework but it is something that the govern-
ment would have to consider. The extreme situations in both national income benefits and
possible absorption difficulties occur when only Young Adult immigrants are admitted to
the country — the distribution (0, 100, 0). With a quota of 10 percent, 29 percent of the
population in that age group are immigrants; with a 20 percent quota, 45 percent are im-
migrants; and with a 30 percent quota the proportion is well over half, 55 percent. Even
with the somewhat less concentrated (0, 67, 33) distribution the proportion in the Young
Adult age group reaches 35 percent with a 20 percent quota and 45 percent with a quota of
30 percent. The policy choice that the government must make poses a tradeoff — accept-
ing a lower level of income per capita than what might be attainable through immigration
vs. possible societal absorption difficulties with a higher immigration quota.
3.5 Productivity Growth as an Offset to Population Aging
The rate of growth of productivity is denoted by g in Equation (4), Section 2.2. We have
set g to zero in all of the simulations thus far. Now we experiment with positive values.
The immigration quota and age distribution are under government control; the rate of
productivity growth is not. The government may be able to nudge the rate a little by this or
that policy but the extent of its influence is no doubt limited. Nevertheless, it is of interest
to see how productivity growth might act as an offset to the negative effect of population
aging on the economy.
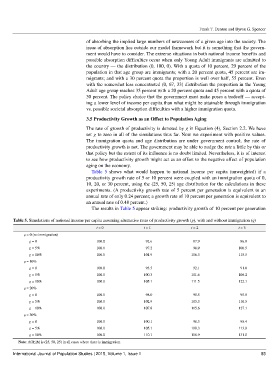
Table 5 shows what would happen to national income per capita (unweighted) if a
productivity growth rate of 5 or 10 percent were coupled with an immigration quota of 0,
10, 20, or 30 percent, using the (25, 50, 25) age distribution for the calculations in these
experiments. (A productivity growth rate of 5 percent per generation is equivalent to an
annual rate of only 0.24 percent; a growth rate of 10 percent per generation is equivalent to
an annual rate of 0.48 percent.)
The results in Table 5 appear striking: productivity growth of 10 percent per generation
Table 5. Simulations of national income per capita assuming alternative rates of productivity growth (g), with and without immigration (q)
t = 0 t = 1 t = 2 t = 3
q = 0 (no immigration)
g = 0 100.0 92.6 87.9 86.8
g = 5% 100.0 97.2 96.9 100.5
g = 10% 100.0 101.9 106.3 115.5
q = 10%
g = 0 100.0 95.5 92.1 91.8
g = 5% 100.0 100.3 101.6 106.2
g = 10% 100.0 105.1 111.5 122.1
q = 20%
g = 0 100.0 98.0 95.5 95.5
g = 5% 100.0 102.9 105.3 110.5
g = 10% 100.0 107.8 115.6 127.1
q = 30%
g = 0 100.0 100.1 98.3 98.4
g = 5% 100.0 105.1 108.3 113.9
g = 10% 100.0 110.1 118.9 131.0
Note: AGEIM is (25, 50, 25) in all cases where there is immigration.
International Journal of Population Studies | 2015, Volume 1, Issue 1 85