
Page 93 - IJPS-1-1
P. 93
Frank T. Denton and Byron G. Spencer
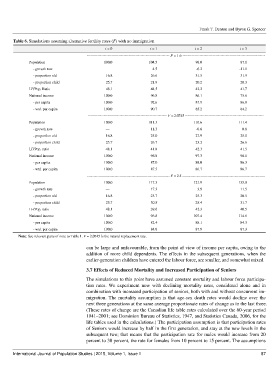
Table 6. Simulations assuming alternative fertility rates (F) with no immigration
t = 0 t = 1 t = 2 t = 3
--------------------------------------------------------------- F = 1.6 ---------------------------------------------------------------
Population 100.0 104.5 98.0 87.1
- growth rate — 4.5 -6.2 -11.1
- proportion old 16.8 26.6 31.5 31.9
- proportion child 25.7 21.9 20.2 20.3
LF/Pop. Ratio 48.1 44.5 42.2 41.7
National income 100.0 96.8 86.1 75.6
- per capita 100.0 92.6 87.9 86.8
- wtd. per capita 100.0 90.7 85.2 84.2
------------------------------------------------------------ F = 2.0745 ------------------------------------------------------------
Population 100.0 111.3 110.6 111.4
- growth rate — 11.3 -0.6 0.8
- proportion old 16.8 25.0 27.9 25.0
- proportion child 25.7 26.7 23.2 26.6
LF/Pop. ratio 48.1 41.8 42.3 41.5
National income 100.0 96.8 97.3 96.1
- per capita 100.0 87.0 88.0 86.3
- wtd. per capita 100.0 87.5 86.7 86.7
--------------------------------------------------------------- F = 2.5 ---------------------------------------------------------------
Population 100.0 117.3 121.9 135.9
- growth rate — 17.3 3.9 11.5
- proportion old 16.8 23.7 25.3 20.5
- proportion child 25.7 30.5 25.4 31.7
LF/Pop. ratio 48.1 39.6 42.3 40.5
National income 100.0 96.8 107.4 114.6
- per capita 100.0 82.4 88.1 84.3
- wtd. per capita 100.0 84.8 87.9 87.3
Note: See relevant parts of note to Table 1. F = 2.0745 is the natural replacement rate.
can be large and unfavourable, from the point of view of income per capita, owing to the
addition of more child dependents. The effects in the subsequent generations, when the
earlier-generation children have entered the labour force, are smaller, and somewhat mixed.
3.7 Effects of Reduced Mortality and Increased Participation of Seniors
The simulations to this point have assumed constant mortality and labour force participa-
tion rates. We experiment now with declining mortality rates, considered alone and in
combination with increased participation of seniors, both with and without concurrent im-
migration. The mortality assumption is that age-sex death rates would decline over the
next three generations at the same average proportionate rates of change as in the last three.
(These rates of change are the Canadian life table rates calculated over the 60-year period
1941–2001; see Dominion Bureau of Statistics, 1947, and Statistics Canada, 2006, for the
life tables used in the calculations.) The participation assumption is that participation rates
of Seniors would increase by half in the first generation, and stay at the new levels in the
subsequent two; that means that the participation rate for males would increase from 20
percent to 30 percent, the rate for females from 10 percent to 15 percent. The assumptions
International Journal of Population Studies | 2015, Volume 1, Issue 1 87