
Page 90 - IJPS-10-2
P. 90
International Journal of
Population Studies Employment-driving effect
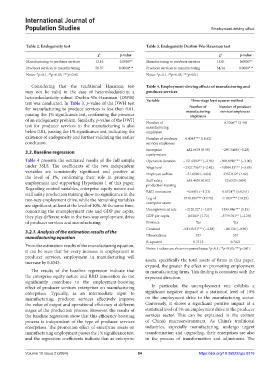
Table 2. Endogeneity test Table 3. Endogeneity Durbin‑Wu‑Hausman test
χ 2 p‑value χ 2 p‑value
Manufacturing to producer services 12.16 0.0005** Manufacturing to producer services 13.01 0.0003**
Producer services to manufacturing 50.57 0.0000*** Producer services to manufacturing 54.34 0.0000***
Notes: *p<0.1, **p<0.05, ***p<0.01. Notes: *p<0.1, **p<0.05, ***p<0.01.
Considering that the traditional Hausman test Table 4. Employment‑driving effects of manufacturing and
may not be valid in the case of heteroskedasticity, a producer services
heteroskedasticity-robust Durbin-Wu-Hausman (DWH)
test was conducted. In Table 3, p-value of the DWH test Variable Three‑stage least squares method
Number of
for manufacturing to produce services is less than 0.01, manufacturing Number of producer
services employees
passing the 1% significance test, confirming the presence employees
of an endogeneity problem. Similarly, p-value of the DWH Number of 0.3306** (2.48)
test for producer services to the manufacturing is also manufacturing
below 0.01, passing the 1% significance test, indicating the employees
existence of endogeneity and further validating the earlier Number of producer 0.4343*** (18.62)
conclusion. services employees
3.2. Baseline regression Enterprise 482.6678 (0.59) −297.5408 (−0.20)
equity nature
Table 4 presents the estimated results of the full sample Operation duration −151.0392** (−2.36) −300.8916*** (−3.00)
under 3SLS. The coefficients of the two independent Wage level −2327.796** (−2.42) −10084.13*** (−5.83)
variables are consistently significant and positive at Employee welfare −31.6869 (−0.04) 2357.812* (1.82)
the level of 1%, confirming their role in promoting
employment and supporting Hypothesis 1 of this paper. Staff safety 653.4455 (0.92) 52.6525 (0.04)
production training
Regarding control variables, enterprise equity nature and
staff safety production training show no significance in the R&D innovation −0.0051 (−1.33) 0.0534** (0.0241)
two-way employment drive, while the remaining variables Log of 4548.856*** (10.76) 0.1031*** (10.25)
are significant, at least at the level of 10%. At the same time, enterprise assets
concerning the unemployment rate and GDP per capita, Unemployment rate −2120.22* (−1.87) 4389.486*** (5.15)
they play different roles in the two-way employment drive GDP per capita 0.0203* (1.72) −3779.701** (−2.24)
of producer services and manufacturing. Province Yes Yes
Constant −64143.51*** (−4.58) −0.0120 (−0.90)
3.2.1. Analysis of the estimation results of the
manufacturing equation Observations 537 537
R-squared 0.7115 0.7021
From the estimation results of the manufacturing equation,
it can be seen that for every increase in employment in Notes: t-values are shown in parentheses; *p<0.1; **p<0.05; ***p<0.01.
producer services, employment in manufacturing will
increase by 0.4343. assets, specifically the total assets of firms in this paper,
expand, the greater the effect on promoting employment
The results of the baseline regression indicate that in manufacturing firms. This finding is consistent with the
the enterprise equity nature and R&D innovation do not expected direction.
significantly contribute to the employment-boosting
effect of producer services enterprises on manufacturing In particular, the unemployment rate exhibits a
enterprises. Typically, as an intermediate input to significant negative impact at a statistical level of 10%
manufacturing, producer services effectively improve on the employment drive in the manufacturing sector.
the value of output and operational efficiency at different Conversely, it shows a significant positive impact at a
stages of the production process. However, the results of statistical level of 1% on employment drive in the producer
the baseline regression show that this efficiency-boosting services sector. This can be explained in the context
process is independent of the type of producer services of China’s macroenvironment. As China’s traditional
enterprises. The promotion effect of enterprise assets on industries, especially manufacturing, undergo urgent
manufacturing employment passes the 1% significance test, transformation and upgrading, their enterprises are also
and the regression coefficients indicate that as enterprise in the process of transformation and adjustment. The
Volume 10 Issue 2 (2024) 84 https://doi.org/10.36922/ijps.0316