
Page 92 - IJPS-10-2
P. 92
International Journal of
Population Studies Employment-driving effect
strategies to reduce costs and maintain survival, and study their employment-boosting effects separately.
necessitating strong support from knowledge-intensive This raises the need to further explore the classification
service industries and consequently increasing of producer services and manufacturing industries into
demand for producer services industries. From a different types and study their employment-driving effects,
demand-supply perspective, producer services, as an respectively.
important supply side for manufacturing, significantly
boost employment. 3.4. Heterogeneity of producer services
Based on the data availability and the classification standard
3.3. Robustness tests
of producer services in China’s National Standard GB/T
To further confirm the results and theoretical analysis 4754-2017, this paper divides producer services into seven
of this paper, we adopt the index measurement method categories. Following the division of the high-tech services
by replacing the dependent variables and conducting industry by the National Bureau of Statistics, producer
3SLS regressions. Following the employment-driving services are further divided into high-tech services and
effect measurement approach (Zhou & Li, 2006), the non-high-tech services. High-tech services include
employment-driven index from manufacturing to producer internet and related services, telecommunications, radio
services is replaced by the proportion of employees in and television, and satellite transmission services, as well
this manufacturing enterprise relative to all employees in as information transmission, software, and information
manufacturing enterprises. Similarly, the employment- technology services. Other industries are classified as non-
driven index from producer services to manufacturing is high-tech services.
replaced by the proportion of employees in this producer
services enterprise relative to all employees in producer The regression results of the analysis on the driving
services enterprises. The results of the robustness tests are effect of producer services on manufacturing employment
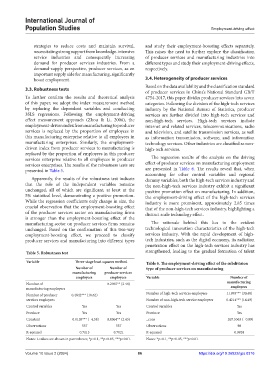
presented in Table 5. are presented in Table 6. The results reveal that, when
accounting for other control variables and regional
Apparently, the results of the robustness test indicate dummy variables, both the high-tech services industry and
that the role of the independent variables remains the non-high-tech services industry exhibit a significant
unchanged, all of which are significant, at least at the positive promotion effect on manufacturing. In addition,
5% statistical level, demonstrating a positive promotion. the employment-driving effect of the high-tech services
While the regression coefficients only change in size, the industry is more prominent, approximately 2.85 times
crucial observation that the employment-boosting effect that of the non-high-tech services industry, highlighting a
of the producer services sector on manufacturing firms distinct scale technology effect.
is stronger than the employment-boosting effect of the
manufacturing sector on producer services firms remains The rationale behind this lies in the evident
unchanged. Based on the confirmation of this two-way technological innovation characteristics of the high-tech
employment-boosting effect, we proceed to classify services industry. With the rapid development of high-
producer services and manufacturing into different types tech industries, such as the digital economy, its radiation
penetration effect on the high-tech services industry has
Table 5. Robustness test strengthened, leading to the gradual formation of talent
Variable Three‑stage least squares method Table 6. The employment‑driving effect of the subdivision
Number of Number of type of producer services on manufacturing
manufacturing producer services
employees employees Variable Number of
Number of 0.2965** (2.48) manufacturing
manufacturing employees employees
Number of producer 0.4842*** (18.62) Number of high-tech services employees 1.1993*** (30.48)
services employees Number of non-high-tech service employees 0.4214*** (16.49)
Control variables Yes Yes Control variables Yes
Province Yes Yes Province Yes
Constant −0.0103*** (−4.58) 0.0064** (2.43) _cons −267.5363 (−0.09)
Observations 537 537 Observations 98
R-squared 0.7115 0.7021 R-squared 0.9838
Notes: t-values are shown in parentheses; *p<0.1, **p<0.05, ***p<0.01. Notes: *p<0.1, **p<0.05, ***p<0.01.
Volume 10 Issue 2 (2024) 86 https://doi.org/10.36922/ijps.0316