
Page 96 - IJPS-10-4
P. 96
International Journal of
Population Studies Mortality shapes population age structures
A B
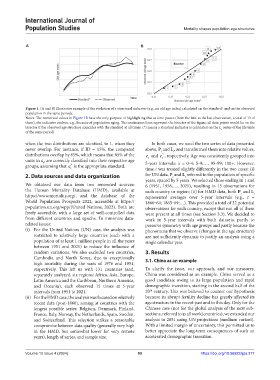
Figure 1. (A and B) Illustrative example of the evolution of a structural indicator (e.g., an old age index) calculated on the standard* and on the observed
population in the same periode.
Notes: The numerical values in Figure 1B have the only purpose of highlighting that as time passes (from the first to the last observation, a total of 13 of
them), the indicator evolves, e.g., because of population aging. The continuous lines represent the bisector of the figure; all data points would lie on the
bisector if the observed age structure coincides with the standard at all times. (*) means a standard indicator is calculated on the L series of the life table
x
of the same period.
when the two distributions are identical, to 1, when they In both cases, we used the two series of data presented
never overlap. For instance, if ID = 15%, the compared above, P and L , and transformed them into relative values,
t
t
distributions overlap by 85%, which means that 85% of the c and c , respectively. Age was consistently grouped into
*
t
t
units in c , are correctly classified into their respective age 5-year intervals: x = 0‒4; 5‒9;…, 95‒99; 100+. However,
t
*
groups, assuming that c is the appropriate standard. time t was treated slightly differently in the two cases: (i)
t
2. Data sources and data organization for UN data, P and L referred to the population of specific
t
t
years, spaced by 5 years. We selected those ending in 1 and
We obtained our data from two renowned sources: 6 (1951, 1956,…, 2021), resulting in 15 observations for
the Human Mortality Database (HMD), available at each country or region; (ii) for HMD data, both P and L
t
https://www.mortality.org/, and the database of the represented averages over 5-year intervals (e.g., t = t
World Population Prospects 2022, accessible at https:// 1860‒64; 1865‒69;…). This provided a total of 32 potential
population.un.org/wpp/(United Nations, 2022). Both are observations for each country, except that not all of them
freely accessible, with a large set of well-controlled data were present at all times (see Section 3.3). We decided to
from different countries and epochs. To minimize data- work in 5-year intervals with both datasets, partly to
related issues: preserve symmetry with age groups and partly because the
(i) For the United Nations (UN) case, the analysis was phenomena that we observe (changes in the age structure)
restricted to relatively large countries (each with a are not sufficiently dynamic to justify an analysis using a
population of at least 1 million people in all the years single calendar year.
between 1951 and 2021) to reduce the influence of
random variations. We also excluded two countries, 3. Results
Cambodia and North Korea, due to exceptionally 3.1. China as an example
high mortality during the wars of 1976 and 1951,
respectively. This left us with 131 countries (and, To clarify the issue, our approach, and our measures,
separately analyzed, six regions: Africa, Asia, Europe, China was considered as an example. China served as a
Latin America and the Caribbean, Northern America, good candidate owing to its large population and rapid
and Oceania), each observed 15 times at 5-year demographic transition, starting in the second half of the
th
intervals from 1951 to 2021. 20 century. This was believed to counter our hypothesis
(ii) For the HMD case, the analysis was focused on relatively because its abrupt fertility decline has greatly affected its
recent data (post-1860), aiming at countries with the age structure in the recent past and to this day. Only for the
longest possible series: Belgium, Denmark, Finland, Chinese case (not for the global analysis of the next sub-
France, Italy, Norway, the Netherlands, Spain, Sweden, sections, referred to as all world countries), we extended our
and Switzerland. This selection strikes a reasonable analysis to 2051 using UN projections (medium variant).
compromise between data quality (generally very high With a limited margin of uncertainty, this permitted us to
in the HMD, but somewhat lower for very remote better appreciate the long-term consequences of such an
years), length of series, and sample size. accelerated demographic transition.
Volume 10 Issue 4 (2024) 90 https://doi.org/10.36922/ijps.377