
Page 98 - IJPS-10-4
P. 98
International Journal of
Population Studies Mortality shapes population age structures
very low nowadays) are clearly visible. Yet, despite these countries went through their demographic transition in the
rather extreme variations, current survival conditions, period under observation (1951 – 2021), and this explains
as expressed by the L series, “explain” a large share of why most of the observed points are under the bisector, which
x
the observed age structure, at least 78% in the worst year means that populations are younger than they “should” be if
(1981), and much more in periods of more gradual change. mortality were the only force at play. However, the results
also suggest that this “unbalanced” phase is temporary: the
3.2. Results for all world countries (1951 – 2021) distance from the bisector increased at first (until A* reaches
In this section, not just China but all world countries with at approximately 36 years, corresponding to a life expectancy
least one million inhabitants were considered. Figure 5 (left [e ] of approximately 60 years) but tends to decrease over
0
panel) reveals the association between the standard average time. The points can be imagined as “moving” rightward
age (A*) of the corresponding stationary population and the (toward better survival conditions), forming a sort of wave
observed average age (A). Quadratic interpolation provided that oscillates around the bisector, where A = A*.
an insight into how the relationship has evolved for different The same tendency, with less “noise,” emerges in the right
values of A*, or, in practice, over time, because higher
values of A* correspond to better survival conditions. Most panel of Figure 5, displaying world regions. In both cases,
the underlying pattern seems to be the same as that observed
in China (Figure 2) and is hypothesized in our model
(Figure 1). Most of the data points in Figure 5 fall below
the bisector, but this is due to the demographic peculiarities
of the observation period. As good demographic data are
generally available only for the recent past, in most cases
after the beginning of the demographic transition, the bulk
of the information that we get refers to the “first wave” of the
scheme of Figure 1 (right panel), where the data points are
below the bisector. In Figure 5 and the following sections, we
do not include projections for the future because their validity
may be questioned, even when they come from authoritative
institutions, and because, in all cases, projections cannot be
treated as observations. Had these projected data points
been plotted in Figure 5, the resulting scheme would have
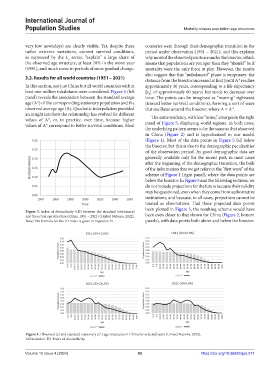
Figure 3. Index of dissimilarity (ID) between the standard (stationary)
and the actual age structure (China, 1951 – 2021) (United Nations, 2022). been even closer to that shown for China (Figure 2, bottom
Note: The formula for the ID index is given in Equation VI. panels), with data points both above and below the bisector.
Figure 4. Observed (c) and standard stationary (c*) age structures in China for selected years (United Nations, 2022).
Abbreviation: ID: Index of dissimilarity.
Volume 10 Issue 4 (2024) 92 https://doi.org/10.36922/ijps.377