
Page 100 - IJPS-10-4
P. 100
International Journal of
Population Studies Mortality shapes population age structures
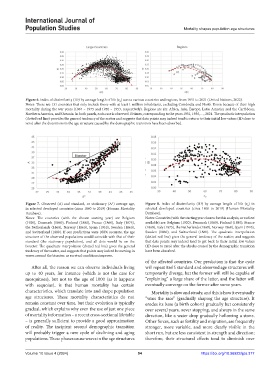
Figure 6. Index of dissimilarity (ID) by average length of life (e ) across various countries and regions, from 1951 to 2021 (United Nations, 2022).
0
Notes: There are 131 countries that only include those with at least 1 million inhabitants, excluding Cambodia and North Korea because of their high
mortality during the war years (1967 – 1975 and 1950 – 1953, respectively). Regions are six: Africa, Asia, Europe, Latin America and the Caribbean,
Northern America, and Oceania. In both panels, each case is observed 15 times, corresponding to the years 1951, 1956,…, 2021. The quadratic interpolation
(dotted red line) provides the general tendency of the scatter and suggests that data points may indeed tend to return to their initial low values (ID close to
zero) after the distortions in the age structure caused by the demographic transition have been absorbed.
Figure 7. Observed (A) and standard, or stationary (A*) average age, Figure 8. Index of dissimilarity (ID) by average length of life (e ) in
0
in selected developed countries (circa 1860 to 2019) (Human Mortality selected developed countries (circa 1860 to 2019) (Human Mortality
Database). Database).
Notes: The countries (with the chosen starting year) are Belgium Notes: Countries (with the starting year chosen for this analysis, or earliest
(1920), Denmark (1860), Finland (1880), France (1860), Italy (1875), available) are: Belgium (1920), Denmark (1860), Finland (1880), France
the Netherlands (1860), Norway (1860), Spain (1910), Sweden (1860), (1860), Italy (1875), the Netherlands (1860), Norway 1860), Spain (1910),
and Switzerland (1880). If our predictions were 100% accurate, the age Sweden (1860), and Switzerland (1880). The quadratic interpolation
structure of the observed populations would coincide with that of their (dotted red line) gives the general tendency of the scatter, and suggests
standard (the stationary population), and all dots would lie on the that data points may indeed tend to get back to their initial low values
bisector. The quadratic interpolation (dotted red line) gives the general (ID close to zero) after the shocks caused by the demographic transition
tendency of the scatter, and suggests that points may indeed be moving in have been absorbed.
waves around the bisector, as survival conditions improve.
of the affected countries. Our prediction is that the cycle
After all, the reason we can observe individuals living will repeat itself: standard and observed age structures will
up to 40 years, for instance (which is not the case for temporarily diverge, but the former will still be capable of
mosquitoes), but not to the age of 1000 (as it happens “explaining” a large share of the latter, and the latter will
with sequoias), is that human mortality has certain eventually converge on the former after some years.
characteristics, which translate into and shape population Mortality is slow and steady, and this is how it eventually
age structures. These mortality characteristics do not “wins the race” (gradually shaping the age structure). It
remain constant over time, but their evolution is typically erodes its base (a birth cohort) gradually but consistently
gradual, which explains why even the use of just one piece over several years, never stopping, and always in the same
of mortality information – a recent cross-sectional life table direction, like a water drop gradually hollowing a stone.
– is generally sufficient to provide a good approximation Other forces, such as fertility and migration, are frequently
of reality. The incipient second demographic transition stronger, more variable, and more clearly visible in the
will probably trigger a new cycle of declining and aging short run, but are less consistent in strength and direction;
populations. These phases cause waves in the age structures therefore, their structural effects tend to diminish over
Volume 10 Issue 4 (2024) 94 https://doi.org/10.36922/ijps.377