
Page 60 - IJPS-11-1
P. 60
International Journal of
Population Studies Macroeconomic factors and housing dynamics
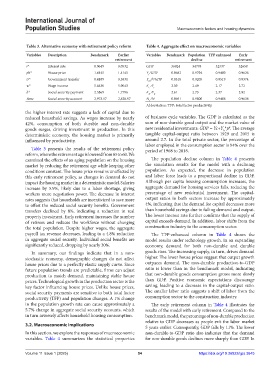
Table 3. Alternative economy with retirement policy reform Table 4. Aggregate effect on macroeconomic variables
Variables Description Benchmark Earlier Variables Benchmark Population TFP enhanced Early
retirement decline retirement
r* Interest rate 0.0649 0.0532 GDP 36924 34793 52337 32658
ph* House price 1.4145 1.4145 Y /GDP 0.9682 0.9794 0.9480 0.9626
c
tr* Government transfer 0.4189 0.3831 Y p /GDP 0.0318 0.0205 0.0519 0.0374
h
h
w* Wage income 5.6430 5.9043 K ⁄Y c 2.39 2.49 2.17 2.72
c
b* Social security payment 2.5869 1.7796 K ⁄Y 2.61 2.73 2.37 2.92
h h
Bene Social security account 2,973.17 2,828.97 N /N 0.9691 0.9800 0.9488 0.9638
c
Abbreviation: TFP: total factor productivity.
the higher interest rate suggests a lack of capital due to
reduced household savings. As wages increase by nearly of business cycle variables. The GDP is calculated as the
42%, consumption of both durable and non-durable sum of non-durable good output and the market value of
h
goods surges, driving investment in production. In this new residential investments: GDP = Yc+Y *p . The average
h
deterministic economy, the housing market is primarily tangible capital-output ratio between 1929 and 2015 is
influenced by productivity. around 2.7. In the total private sector, the percentage of
labor employed in the consumption sector is 94% over the
Table 3 presents the results of the retirement policy period of 1968 to 2018.
reform, where the retirement age is lowered from 65 to 60. We
examined the effects of an aging population on the housing The population decline column in Table 4 presents
market by reducing the retirement age while keeping other the simulation results for the model with a declining
conditions constant. The house price remains unaffected by population. As expected, the decrease in population
this early retirement policy, as changes in demand do not and labor force leads to a proportional decline in GDP.
impact the housing market in a deterministic model. Salaries Although per capita housing consumption increases, the
increase by 5.9%, likely due to a labor shortage, giving aggregate demand for housing services falls, reducing the
workers more negotiation power. The decrease in interest percentage of new residential investment. The capital-
rates suggests that households are incentivized to save more output ratios in both sectors increase by approximately
to offset the reduced social security benefits. Government 4%, indicating that the demand for capital decreases more
transfers declined by 8%, indicating a reduction in real than household savings due to falling demand and output.
property investment. Early retirement increases the number The lower interest rate further confirms that the supply of
of retirees and reduces the workforce without changing capital exceeds demand. In addition, labor shifts from the
the total population. Despite higher wages, the aggregate construction industry to the consumption sector.
payroll tax revenue decreases, leading to a 4.8% reduction The TFP-enhanced column in Table 4 shows the
in aggregate social security. Individual social benefits are model results under technology growth. In an expanding
significantly reduced, dropping by nearly 30%. economy, demand for both non-durable and durable
In summary, our findings indicate that in a non- goods rises. The increasing supply, in turn, drives demand
stochastic economy, demographic changes do not affect higher. The lower house prices suggest that output growth
house prices due to a perfectly elastic supply curve. Since outpaces demand. The non-durable production-to-GDP
future population trends are predictable, firms can adjust ratio is lower than in the benchmark model, indicating
production to match demand, maintaining stable house that non-durable goods consumption grows more slowly
prices. Technological growth in the production sector is the than GDP. Positive economic expectations discourage
key factor influencing house prices. Unlike house prices, saving, leading to a decrease in the capital-output ratio.
social security payments are sensitive to both total factor The smaller labor ratio suggests a shift of labor from the
productivity (TFP) and population changes. A 1% change consumption sector to the construction industry.
in the population growth rate can cause approximately a The early retirement column in Table 4 illustrates the
5.7% change in aggregate social security accounts, which results of the model with early retirement. Compared to the
in turn inversely affects household housing consumption. benchmark model, the percentage of non-durable production
relative to GDP decreases as people exit the labor market
3.2. Macroeconomic implications 5 years earlier. Consequently, GDP falls by 11%. The lower
In this section, we explore the responses of macroeconomic non-durable-to-GDP ratio also indicates that the demand
variables. Table 4 summarizes the statistical properties for non-durable goods declines more sharply than GDP. In
Volume 11 Issue 1 (2025) 54 https://doi.org/10.36922/ijps.3645