
Page 62 - IJPS-11-1
P. 62
International Journal of
Population Studies Macroeconomic factors and housing dynamics
A B
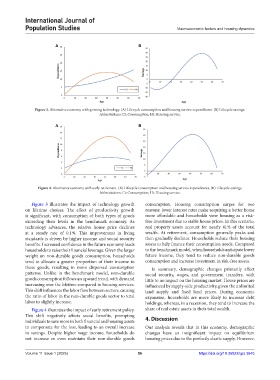
Figure 3. Alternative economy with growing technology. (A) Lifecycle consumption and housing service expenditures. (B) Lifecycle savings.
Abbreviations: Ct: Consumption; Ht: Housing service.
A B
Figure 4. Alternative economy with early retirement. (A) Lifecycle consumption and housing service expenditures. (B) Lifecycle savings.
Abbreviations: Ct: Consumption; Ht: Housing service.
Figure 3 illustrates the impact of technology growth consumption. Housing consumption surges for two
on lifetime choices. The effect of productivity growth reasons: lower interest rates make acquiring a better home
is significant, with consumption of both types of goods more affordable and households view housing as a risk-
exceeding their levels in the benchmark economy. As free investment due to stable house prices. In this scenario,
technology advances, the relative house price declines real property assets account for nearly 41% of the total
at a steady rate of 0.1%. This improvement in living wealth. At retirement, consumption generally peaks and
standards is driven by higher income and social security then gradually declines. Households reduce their housing
benefits. Increased confidence in the future economy leads assets to help finance their consumption needs. Compared
households to raise their financial leverage. Given the larger to the benchmark model, when households anticipate lower
weight on non-durable goods consumption, households future income, they tend to reduce non-durable goods
tend to allocate a greater proportion of their income to consumption and increase investment in risk-free assets.
these goods, resulting in more dispersed consumption In summary, demographic changes primarily affect
patterns. Unlike in the benchmark model, non-durable social security, wages, and government transfers, with
goods consumption follows an upward trend, with demand little to no impact on the housing market. House prices are
increasing over the lifetime compared to housing services. influenced by supply-side productivity, given the unlimited
This shift influences the labor flow between sectors, causing land supply and fixed land prices. During economic
the ratio of labor in the non-durable goods sector to total expansion, households are more likely to increase debt
labor to slightly increase. holdings, whereas, in a recession, they tend to increase the
Figure 4 illustrates the impact of early retirement policy. share of real estate assets in their total wealth.
This shift negatively affects social benefits, prompting
individuals to save more in both financial and housing assets 4. Discussion
to compensate for the loss, leading to an overall increase Our analysis reveals that in this economy, demographic
in savings. Despite higher wage income, households do changes have an insignificant impact on equilibrium
not increase or even maintain their non-durable goods housing prices due to the perfectly elastic supply. However,
Volume 11 Issue 1 (2025) 56 https://doi.org/10.36922/ijps.3645