
Page 61 - IJPS-11-1
P. 61
International Journal of
Population Studies Macroeconomic factors and housing dynamics
the benchmark model, the share of newly constructed houses financial assets keep decreasing and are used to finance
relative to GDP is lower than in the early retirement scenario, expenditures on consumption and housing services.
where individuals increase their investment in real property Figure 2 shows the life-cycle profiles of individual variables
to offset the loss in retirement benefits. Both capital-output under a decreasing population scenario. Compared to the
ratios rise by 11%, and households’ financial assets are higher
than in the benchmark economy. The shift in labor from the benchmark model, the entire savings curve shifts downward.
non-durable to the durable goods industry is driven by the The declining demand leads to reduced production, which
increased demand for housing. further decreases the demand for input factors, resulting in a
lower interest rate than in the benchmark.
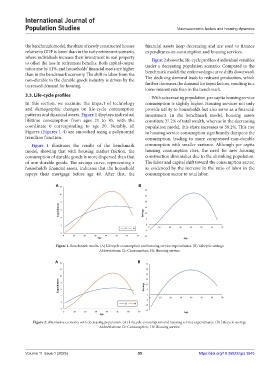
3.3. Life-cycle profiles With a decreasing population, per capita housing service
In this section, we examine the impact of technology consumption is slightly higher. Housing services not only
and demographic changes on life-cycle consumption provide utility to households but also serve as a financial
patterns and financial assets. Figure 1 displays individual investment. In the benchmark model, housing assets
lifetime consumption from ages 21 to 85, with the constitute 37.2% of total wealth, whereas in the decreasing
coordinate 0 corresponding to age 20. Notably, all population model, this share increases to 39.2%. This rise
Figures (Figures 1-4) are smoothed using a polynomial in housing service consumption significantly dampens the
trendline function. consumption, leading to more compressed non-durable
Figure 1 illustrates the results of the benchmark consumption with smaller variance. Although per capita
model, showing that with housing market friction, the housing consumption rises, the need for new housing
consumption of durable goods is more dispersed than that construction diminishes due to the shrinking population.
of non-durable goods. The savings curve, representing a The labor and capital shift toward the consumption sector,
household’s financial assets, indicates that the household as evidenced by the increase in the ratio of labor in the
repays their mortgage before age 40. After that, the consumption sector to total labor.
A B
Figure 1. Benchmark results. (A) Lifecycle consumption and housing service expenditures. (B) Lifecycle savings.
Abbreviations: Ct: Consumption; Ht: Housing service.
A B
Figure 2. Alternative economy with decreasing population. (A) Lifecycle consumption and housing service expenditures. (B) Lifecycle savings.
Abbreviations: Ct: Consumption; Ht: Housing service.
Volume 11 Issue 1 (2025) 55 https://doi.org/10.36922/ijps.3645