
Page 69 - IJPS-11-1
P. 69
International Journal of
Population Studies Health-related quality of life and mortality
were systematically drawn, ordered by the percentage of encompassing all causes of mortality. For participants who
heads of households with higher education. were still alive at the end of the study (December 31, 2018),
To identify deaths among participants from the 2008 their time was censored.
survey, we linked the ISACamp data with the Mortality The independent variables included eight domains
Information System maintained by the Municipal and two components of HRQoL. HRQoL was assessed
Health Department of Campinas (São Paulo, Brazil) from using the SF-36 (Ware, 2007). A slightly modified version
2008 to 2018. This linkage involved both deterministic of the Quality Metric Incorporated (IQOLA - SF-36v2™
and probabilistic methods executed using STATA 15.0 Health Survey Standard, Brazil - Portuguese) was utilized
(Stata Corp., College Station, USA), using variables such to adapt to the ISACamp questionnaire. The SF-36 has
as name, gender, and date of birth. Death information been translated and validated for the Brazilian population
was matched with records that satisfactorily paired, while (Ciconelli, 1997), with normative data established by
non-deaths were assigned to unmatched records. In instances Laguardia et al. (2013). The SF-36 consists of 36 questions
where death status could not be determined, an active search grouped into eight scales – physical functioning,
was conducted via telephone calls. If necessary, home visits role-physical, bodily pain, general health, vitality,
were conducted to validate each participant’s status. role-emotional, social functioning, and mental health.
The tracking of patients was carried out by a team of Scores from these questions were aggregated to create a
trained interviewers, who received guidance on effectively scale ranging from 0 to 100, with higher scores indicating
approaching older adults, both in person and over the better QoL (Ware, 2007).
telephone, to minimize data loss. During home visits where The instrument enables the calculation of two summary
selected participants could not be located, interviewers components – the physical component (PC) and the mental
were instructed to consult other household members component (MC). The PC score includes the scales of
or neighbors. Participants who could not be contacted bodily pain, physical functioning, and role-physical, while
after three telephone attempts and three home visits were the MC score comprises role-emotional, social functioning,
classified as losses and excluded from the study. and mental health scales. In addition, the vitality and
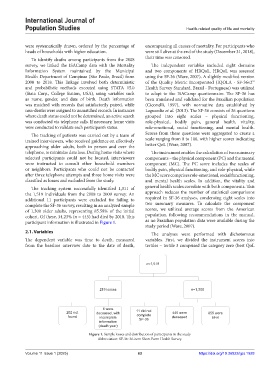
The tracking system successfully identified 1,311 of general health scales correlate with both components. This
the 1,519 individuals from the 2008 to 2009 survey. An approach reduces the number of statistical comparisons
additional 11 participants were excluded for failing to required in SF-36 analyses, condensing eight scales into
complete the SF-36 survey, resulting in an analyzed sample two summary measures. To calculate the component
of 1,300 older adults, representing 85.58% of the initial scores, we utilized average scores from the American
cohort. Of these, 34.23% (n = 445) had died by 2018. This population, following recommendations in the manual,
participant information is illustrated in Figure 1. as no Brazilian population data were available during the
study period (Ware, 2007).
2.1. Variables The analyses were performed with dichotomous
The dependent variable was time to death, measured variables. First, we divided the instrument scores into
from the baseline interview date to the date of death, tertiles – tertile 3 comprised the category zero (best QoL
n=1,519
219 losses n=1,300
6 were
202 not deceased, with 11 did not 445 were 855 were
found incomplete complete deceased alive
SF-36
information
(death year)
Figure 1. Sample losses and distribution of participants in the study
Abbreviation: SF-36: 36-item Short Form Health Survey.
Volume 11 Issue 1 (2025) 63 https://doi.org/10.36922/ijps.1928