
Page 70 - IJPS-11-1
P. 70
International Journal of
Population Studies Health-related quality of life and mortality
and health status), and tertiles 1 and 2 comprised the as white. Only 17.7% of participants earned three or more
category one (worst QoL and health status). Then, we minimum wages, and 29.2% had more than 8 years of
evaluated the scales of physical functioning (0 ≥ 90; 1 ≤ 85), education (Table 1).
role-physical (0 ≥ 99; 1 ≤ 93.75), bodily pain (0 ≥ 80; Utilizing the Kaplan–Meier method, we found that
1 ≤ 74), general health (0 ≥ 75; 1 ≤ 72), vitality (0 ≥ 81.25; all HRQoL domains exhibited proportional risks and
1 ≤ 75), role-emotional (0 ≥ 99; 1 ≤ 92), social functioning statistically significant differences (p < 0.05) between the
(0 = 100; 1 ≤ 99), and mental health (0 ≥ 80; 1 ≤ 75). The survival curves, except for bodily pain. The lowest survival
cutoff scores for the physical (0 ≥ 50.2117; 1 ≤ 50.2109)
and mental (0 ≥ 55.6867; 1 ≤ 55.6861) components were rates were observed in individuals reporting lower scores
also defined. in physical functioning and role-physical, followed by
role-emotional, social functioning, and general health
Additional independent variables included gender, age (Figures 2 and 3). Both PC and MC displayed proportional
(60 – 69 years, 70 – 79 years, and ≥80 years), race/color risks and significant differences, with lower survival
(white and black/brown), education (0 – 3, 4 – 7, and associated with PC (Figure 4).
≥8 years), income (<1 minimum wage (MW), 1 – 3 MWs
and ≥3 MWs), with 415.00 Brazilian real as the reference In terms of physical functioning, 50% of deaths in the
MW in 2008 (Law 11709/2008), number of chronic tertile with the highest score (THS) occurred at 5.91 years,
diseases (none, one, or two, or more), and physical activity while in the tertile with the lowest score (TLS), this occurred
(active, insufficiently active, and inactive). at 5.06 years. The survival times for other domains were
as follows: role-physical (5.84 THS vs. 4.97 TLS), bodily
All independent variables were collected at baseline; pain (5.56 THS vs. 5.15 TLS), general health (5.33 THS vs.
in other words, there were no time-dependent variables 5.28 TLS), vitality (5.60 THS vs. 5.08 TLS), role-emotional
included in this study. (5.77 THS vs. 4.47 TLS), social functioning (5.58 THS vs.
2.2. Data analysis
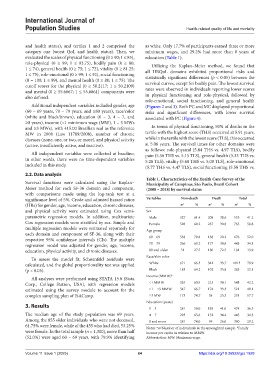
Table 1. Characteristics of the Health Care Survey of the
Survival functions were calculated using the Kaplan– Municipality of Campinas, São Paulo, Brazil Cohort
Meier method for each SF-36 domain and component, (2008 – 2018) by survival status
with comparisons made using the log-rank test at a
significance level of 5%. Crude and adjusted hazard ratios Variables Non‑death Death Total
(HRs) for gender, age, income, education, chronic diseases, n a % n a % n a %
and physical activity were estimated using Cox semi- Sex
parametric regression models. In addition, multivariate Male 327 61.4 208 38.6 535 41.2
Cox regression models were stratified by sex. Simple and Female 528 69.2 237 30.8 765 58.8
multiple regression models were estimated separately for Age group
each domain and component of SF-36, along with their
respective 95% confidence intervals (CIs). The multiple 60 – 69 538 79.8 138 20.2 676 52.0
regression model was adjusted for gender, age, income, 70 – 79 266 60.2 177 39.8 443 34.1
education, physical activity, and chronic diseases. 80 and older 51 27.5 130 72.5 181 13.9
To assess the model fit, Schoenfeld residuals were Race/skin color
calculated, and the global proportionality test was applied White 671 66.3 342 33.7 1013 79.9
(p < 0.05). Black 183 64.2 102 35.8 285 22.1
Income (MMW) b
All analyses were performed using STATA 15.0 (Stata
Corp., College Station, USA), with regression models <1 MMW 335 60.9 213 39.1 548 42.2
estimated using the survey module to account for the ≥1 – ≤3 MMW 347 66.7 174 33.3 521 40.1
complex sampling plan of ISACamp. ≥3 MW 173 74.7 58 25.3 231 17.7
Education (years)
3. Results 0 – 3 281 59.0 193 41.0 474 36.5
The median age of the study population was 69 years. 4 – 7 293 65.6 152 34.4 445 34.3
Among the 855 older individuals who were not deceased, 8 and more 281 74.0 99 26.0 380 29.2
61.75% were female, while of the 455 who had died, 53.25% Notes: n=Number of individuals in the unweighted sample. Family
b
a
were female. In the total sample (n = 1,300), more than half income per capita in relation to MMW.
(52.0%) were aged 60 – 69 years, with 79.9% identifying Abbreviation: MW: Minimum wage.
Volume 11 Issue 1 (2025) 64 https://doi.org/10.36922/ijps.1928