
Page 106 - IJPS-11-2
P. 106
International Journal of
Population Studies Do female-headed households have poorer finances?
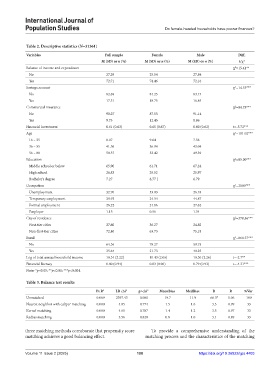
Table 2. Descriptive statistics (N=31361)
Variables Full sample Female Male Diff.
M (SD) or n (%) M (SD) or n (%) M (SD) or n (%) t/χ 2
Balance of income and expenditure χ =15.41**
2
No 27.29 25.54 27.84
Yes 72.71 74.46 72.16
2
Savings account χ =14.53***
No 82.69 81.25 83.15
Yes 17.31 18.75 16.85
Commercial insurance χ =84.75***
2
No 90.27 87.55 91.14
Yes 9.73 12.45 8.86
Financial investment 0.61 (0.63) 0.65 (0.67) 0.60 (0.62) t=-5.72***
Age χ =101.02***
2
16 – 35 8.07 9.64 7.56
36 – 55 41.56 36.94 43.04
56 – 80 50.37 53.42 49.39
Education χ =85.00***
2
Middle school or below 65.90 61.71 67.24
High school 26.83 29.52 25.97
Bachelor’s degree 7.27 8.77 | 6.79
Occupation χ =2000***
2
Unemployment 32.70 53.03 26.18
Temporary employment 39.93 24.54 44.87
Formal employment 26.22 21.86 27.62
Employer 1.15 0.56 1.34
City of residence χ =378.56***
2
First-tier cities 27.60 36.27 24.82
Non-first-tier cities 72.40 63.73 75.18
Rural χ =860.37***
2
No 64.36 78.27 59.75
Yes 35.64 21.73 40.25
Log of total annual household income 10.34 (2.22) 10.43 (2.06) 10.30 (2.26) t=-2.7**
Financial literacy 0.80 (0.94) 0.83 (0.96) 0.79 (0.93) t=-4.31***
Note: *p<0.05; **p<0.01; ***p<0.001.
Table 3. Balance test results
Ps R 2 LR chi 2 p>chi 2 MeanBias MedBias B R %Var
Unmatched 0.069 2397.43 0.000 19.7 11.9 66.3* 1.06 100
Nearest neighbor with caliper matching 0.000 4.05 0.774 1.5 1.6 3.3 0.99 33
Kernel matching 0.000 4.61 0.707 1.4 1.2 3.5 0.97 33
Radius matching 0.000 3.56 0.828 0.8 1.0 3.1 0.89 33
three matching methods corroborate that propensity score To provide a comprehensive understanding of the
matching achieves a good balancing effect. matching process and the characteristics of the matching
Volume 11 Issue 2 (2025) 100 https://doi.org/10.36922/ijps.4403