
Page 109 - IJPS-11-2
P. 109
International Journal of
Population Studies Do female-headed households have poorer finances?
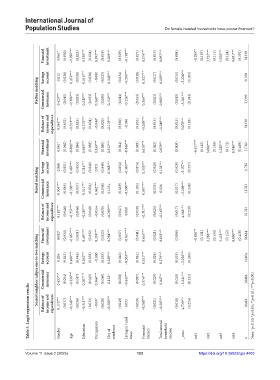
Financial investment 0.061* (0.030) −0.992*** (0.023) 0.530*** (0.024) 0.392*** (0.019) 0.269*** (0.029) −0.758*** (0.027) 0.574*** (0.015) 0.097*** (0.008) −0.285** (0.107) 3.723*** (0.111) 5.928*** (0.124) 9.651*** (0.392) 31339
Radius matching Savings Commercial account insurance 0.012 0.423*** (0.036) (0.045) 0.459*** −0.380*** (0.030) (0.033) 0.116*** 0.243*** (0.028) (0.033) −0.001 0.360*** (0.023) (0.030) 0.348*** 0.150*** (0.034) (0.044) −0.203*** −0.226*** (0.038) (0.053) 0.322*** 0.364*** (0.017) (0.021) 0.189*** 0.063*** (0.015) (0.015) −5.224*** −3.281*** (0.183) (0.184) 31339 31339
Balance of income and expenditure 0.184*** (0.032) −0.311*** (0.025) −0.270*** (0.024) −0.044* (0.020) −0.176*** (0.030) −0.041 (0.032) −0.268*** (0.015) −0.249*** (0.015) 5.078*** (0.183) 31339
Financial investment 0.061 + (0.040) −0.866*** (0.036) 0.503*** (0.038) 0.359*** (0.030) 0.352*** (0.044) −0.846*** (0.049) 0.619*** (0.025) 0.029** (0.009) −0.617*** (0.145) 3.080*** (0.149) 5.280*** (0.172) 8.546*** (0.469) 11782
Kernel matching Savings Commercial account insurance 0.060 0.504*** (0.051) (0.065) 0.482*** −0.306*** (0.053) (0.057) 0.214*** 0.311*** (0.046) (0.054) 0.011 0.362*** (0.040) (0.048) 0.368*** 0.125+ (0.054) (0.069) −0.303*** −0.500*** (0.074) (0.103) 0.353*** 0.397*** (0.028) (0.035) 0.154*** 0.026 (0.020) (0.017) −5.157*** −3.209*** (0.257) (0.248) 11782 11782
Balance of Financial income and investment expenditure 0.185*** 0.082* (0.044) (0.034) −0.352*** −0.867*** (0.044) (0.031) −0.287*** 0.497*** (0.040) (0.032) −0.055+ 0.333*** (0.033) (0.025) −0.269*** 0.284*** (0.047) (0.037) 0.060 −0.827*** (0.059) (0.041) −0.317*** 0.616*** (0.025) (0.021) −0.165*** 0.053*** (0.017) (0.009) 4.368*** (0.229) −0.420** (0.131) 3.288*** (0.134) 5.453*** (0.152) 8.896*** (0
Nearest neighbor caliper one‑to‑two matching Savings Commercial account insurance 0.026 0.433*** (0.043) (0.054) 0.480*** −0.336*** (0.044) (0.047) 0.162*** 0.267*** (0.039) (0.045) −0.000 0.366*** (0.033) (0.040) 0.328*** 0.122* (0.046) (0.058) −0.305*** −0.443*** (0.061) (0.087) 0.331*** 0.374*** (0.024) (0.029) 0.179*** 0.047** (0.019) (0.018) −5.256*** −3.241*** (0.240) (0.231) 16464 16464
Table 5. Logit regression results Balance of income and expenditure 0.173*** (0.037) −0.348*** (0.036) −0.311*** Education (0.033) −0.037 Occupation (0.028) −0.200*** (0.040) 0.055 Living in rural (0.050) −0.288*** Financial (0.021) −0.202*** Total annual household (0.018) 4.730*** (0.224) 16464 Note: + p<0.10; *p<0.05; **p<0.01; ***p<0.001.
Gender
cut3
cut4
cut2
n
Volume 11 Issue 2 (2025) Age City of residence areas 103 literacy income _cons cut1 https://doi.org/10.36922/ijps.4403