Page 28 - IJPS-11-2
P. 28

International Journal of
            Population Studies                                                  Living alone and loneliness in older adults


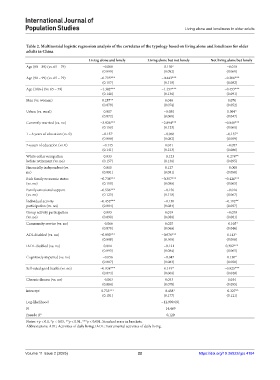
            Table 2. Multinomial logistic regression analysis of the correlates of the typology based on living alone and loneliness for older
            adults in China
                                       Living alone and lonely  Living alone but not lonely  Not living alone but lonely
            Age (80 – 89) (vs. 65 – 79)      −0.008                    0.159 +                   −0.010
                                             (0.099)                   (0.092)                   (0.069)
            Age (90 – 99) (vs. 65 – 79)     −0.735***                 −0.443***                  −0.306***
                                             (0.117)                   (0.110)                   (0.082)
            Age (100+) (vs. 65 – 79)        −1.382***                 −1.157***                  −0.453***
                                             (0.140)                   (0.136)                   (0.091)
            Men (vs. women)                 0.257**                    0.040                      0.070
                                             (0.079)                   (0.074)                   (0.052)
            Urban (vs. rural)                0.007                     −0.030                     0.094*
                                             (0.072)                   (0.068)                   (0.047)
            Currently married (vs. no)      −3.926***                 −2.894***                  −0.848***
                                             (0.159)                   (0.123)                   (0.069)
            1 – 6 years of education (vs. 0)  −0.157 +                 −0.068                    −0.137*
                                             (0.088)                   (0.082)                   (0.059)
            7+years of education (vs. 0)     −0.145                    0.041                     −0.057
                                             (0.141)                   (0.123)                   (0.086)
            White-collar occupation          0.033                     −0.123                    −0.278**
            before retirement (vs. no)       (0.157)                   (0.136)                   (0.095)
            Financially independent (vs.     0.010                     0.127                     −0.008
            no)                              (0.091)                   (0.081)                   (0.058)
            Rich family economic status     −0.736***                 −0.357***                  −0.426***
            (vs. no)                         (0.110)                   (0.086)                   (0.065)
            Family emotional support        −0.536***                  −0.156                    −0.016
            (vs. no)                         (0.123)                   (0.118)                   (0.067)
            Individual activity             −0.452***                  −0.130                    −0.192**
            participation (vs. no)           (0.084)                   (0.084)                   (0.057)
            Group activity participation     0.093                     0.019                     −0.070
            (vs. no)                         (0.090)                   (0.080)                   (0.061)
            Community service (vs. no)       −0.066                    0.025                     −0.105*
                                             (0.070)                   (0.066)                   (0.046)
            ADL disabled (vs. no)           −0.950***                 −0.976***                   0.143*
                                             (0.099)                   (0.100)                   (0.058)
            IADL disabled (vs. no)           0.014                     −0.121                    0.302***
                                             (0.093)                   (0.084)                   (0.065)
            Cognitively impaired (vs. no)    −0.056                    −0.047                     0.130*
                                             (0.087)                   (0.083)                   (0.058)
            Self-rated good health (vs. no)  −0.938***                 0.149*                    −0.825***
                                             (0.074)                   (0.066)                   (0.048)
            Chronic disease (vs. no)         −0.003                    0.053                      0.034
                                             (0.084)                   (0.078)                   (0.055)
            intercept                       0.733***                  −0.458*                    −0.327**
                                             (0.181)                   (0.177)                   (0.121)
            Log-likelihood                                            −12,909.691
            N                                                          14,469
            Pseudo R 2                                                  0.129
            Notes: +p < 0.1, *p < 0.05, **p < 0.01, ***p < 0.001. Standard error in brackets.
            Abbreviations: ADL: Activities of daily living; IADL: Instrumental activities of daily living.


            Volume 11 Issue 2 (2025)                        22                        https://doi.org/10.36922/ijps.4184
   23   24   25   26   27   28   29   30   31   32   33