
Page 38 - IJPS-11-2
P. 38
International Journal of
Population Studies Satellite data analysis of South Africa population grid
distribution of the population over geographical areas.
Evaluation of the censuses of these regions is relatively
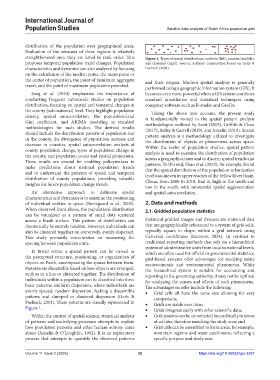
straightforward once they are listed in rank order. This Figure 1. Types of spatial distributions: uniform (left), random (middle),
proposes temporal population trend changes. Population and clustered (right). Source: Authors’ construction based on Getis &
characteristics and dynamics can also analyzed by focusing Paelinck (2004).
on the calculation of the median point, the mean point or
the center of population, the point of minimum aggregate and their origins. Modern spatial analysis is generally
travel, and the point of maximum population potential.
performed using a geographic information system (GIS). It
Sang et al. (2024) emphasizes the importance of becomes even more powerful when a GIS system combines
conducting frequent nationwide studies on population standard quantitative and statistical techniques using
distribution, focusing on spatial and temporal changes at computer software such as R-studio and GeoDa.
the county (sub-national) level. They highlight population Taking the above into account, the present study
density, spatial autocorrelation, the population-land is fundamentally rooted in the spatial pattern analysis
Gini coefficient, and ARIMA modeling as standard methodologies outlined by Scott (2015), Griffith & Chun
methodologies for such studies. The derived results (2017), Bailey & Gatrell (2019), and Anselin (2019). Spatial
should include the distribution pattern of population size pattern analysis is a methodology utilized to investigate
in the county, the divergence of population increase and the distribution of objects or phenomena across space.
decrease in counties, spatial autocorrelation analysis of Within the realm of population studies, spatial pattern
county population change, types of population change in analysis is used to examine the distribution of population
the county, and population count and spatial projections. across a geographical area and to discern spatial trends and
These results are crucial for enabling policymakers to patterns. To this end, Zhao et al. (2022), for example, found
make predictions about national population trends that the spatial distribution of the population urbanization
and to understand the patterns of spatial and temporal level was uneven in upper reaches of the Yellow River Basin,
distribution of county populations, providing valuable China, from 2000 to 2018, that is, high in the north and
insights for future population change trends.
low in the south, with substantial spatial agglomeration
An alternative approach to delineate spatial and spatial autocorrelation.
characteristics and dynamics is to examine the positioning
of individual entities in space (Borregaard et al., 2009). 2. Data and methods
When observed from above, the population’s distribution 2.1. Gridded population statistics
can be visualized as a pattern of small dots scattered
across a blank surface. This pattern of distribution can Statistical gridded images and datasets are statistical data
theoretically be entirely random. However, individuals can that are geographically referenced to a system of grid cells,
also be clustered together or, conversely, evenly dispersed. typically square in shape, within a grid network using
This study primarily concentrates on measuring the Cartesian coordinates (Eurostat, 2024). In contrast to
spacing between population units. traditional reporting methods that rely on a hierarchical
system of administrative units from local to national levels,
In broad terms, a spatial pattern can be viewed as which are often used for official or governmental statistics,
the perceptual structure, positioning, or organization of grid-based systems offer advantages for studying many
objects on Earth, encompassing the spaces between them. socioeconomic and environmental phenomena. While
Patterns are discernible based on how objects are arranged, the hierarchical system is suitable for accounting and
such as in a line or clustered together. The distribution of reporting to the governing authority, it may not be optimal
individuals within a population can be classified into three for analyzing the causes and effects of such phenomena.
basic patterns: uniform dispersion, where individuals are The advantages on offer include the following:
evenly spaced; random dispersion, lacking a discernible • Grid cells all have the same size allowing for easy
pattern; and clumped or clustered dispersion (Getis & comparison;
Paelinck, 2004). These patterns are visually represented in • Grids are stable over time;
Figure 1. • Grids integrate easily with other scientific data;
Within the context of spatial science, statistical analysis • Grid systems can be constructed hierarchically in terms
of patterns and underlying processes attempts to explain of cell size, therefore matching the study area; and
how population patterns and other human activity came • Grid cells can be assembled to form areas, for example,
about (Anselin & O’Loughlin, 1992). It is an exploratory mountain regions and water catchments, reflecting a
process that attempts to quantify the observed patterns specific purpose and study area.
Volume 11 Issue 2 (2025) 32 https://doi.org/10.36922/ijps.3297