
Page 41 - IJPS-11-2
P. 41
International Journal of
Population Studies Satellite data analysis of South Africa population grid
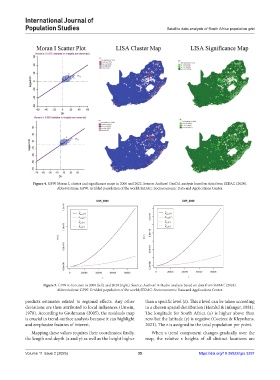
Figure 4. GPW Moran I, cluster and significance maps in 2000 and 2022. Source: Authors’ GeoDA analysis based on data from SEDAC (2024).
Abbreviations: GPW: Gridded population of the world; SEDAC: Socioeconomic Data and Applications Center.
Figure 5. GPW K-function in 2000 (left) and 2020 (right). Source: Authors’ R-Studio analysis based on data from SEDAC (2024).
Abbreviations: GPW: Gridded population of the world; SEDAC: Socioeconomic Data and Applications Center.
predicts estimates related to regional effects. Any other than a specific level (z). This z level can be taken according
deviations are then attributed to local influences (Unwin, to a chosen spatial distribution (Hembd & Infanger, 1981).
1978). According to Grohmann (2005), the residuals map The longitude for South Africa (x) is higher above than
is crucial in trend-surface analysis because it can highlight zero but the latitude (y) is negative (Coetzee & Kleynhans,
and emphasize features of interest. 2021). The z is assigned to the total population per point.
Mapping these values requires their coordinates; firstly, When a trend component changes gradually over the
the length and depth (x and y) as well as the height higher map, the relative z heights of all distinct locations are
Volume 11 Issue 2 (2025) 35 https://doi.org/10.36922/ijps.3297