
Page 137 - IJPS-11-3
P. 137
International Journal of
Population Studies Drivers of reproductive delay in the UK
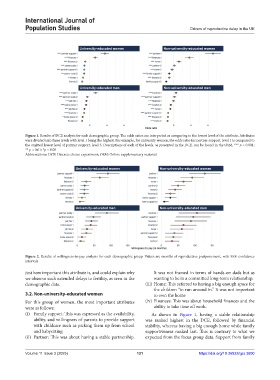
Figure 1. Results of DCE analysis for each demographic group. The odds ratios are interpreted as comparing to the lowest level of the attribute. Attributes
were divided into three levels with level 1 being the highest. For example, for university women, the odds ratio for partner support, level 1 is compared to
the omitted lowest level of partner support, level 3. Descriptions of each of the levels, as presented in the DCE, can be found in the OSM. *** p < 0.001;
** p < 0.01; *p < 0.05
Abbreviations: DCE: Discrete choice experiment; OSM: Online supplementary material.
Figure 2. Results of willingness-to-pay analysis for each demographic group. Values are months of reproductive postponement, with 95% confidence
intervals
just how important this attribute is, and could explain why It was not framed in terms of hands-on dads but as
we observe such extended delays to fertility, as seen in the wanting to be in a committed long-term relationship.
demographic data. (iii) Home: This referred to having a big enough space for
the children “to run around in.” It was not important
3.2. Non-university-educated women to own the home
For this group of women, the most important attributes (iv) Finances: This was about household finances and the
were as follows: ability to take time off work.
(i) Family support: This was expressed as the availability, As shown in Figure 1, having a stable relationship
ability, and willingness of parents to provide support was ranked highest in the DCE, followed by financial
with childcare such as picking them up from school stability, whereas having a big enough home while family
and babysitting supportiveness ranked last. This is contrary to what we
(ii) Partner: This was about having a stable partnership. expected from the focus group data. Support from family
Volume 11 Issue 3 (2025) 131 https://doi.org/10.36922/ijps.3600