
Page 35 - IJPS-11-3
P. 35
International Journal of
Population Studies Marital dissolution in India
a clearer understanding of the overview of divorce and 2.2. Analysis
separation in India. Utilizing the NFHS-5 dataset, this paper employed descriptive
2. Methods statistics and the multivariate logistic regression approach to
examine the relationship between marital dissolution and its
2.1. Data correlates among ever-married women in India.
The present study utilized data from the fifth round of the 2.2.1. Outcome variable
National Family Health Surveys (NFHS-5), conducted
from 2019 to 2021. The NFHS is a large-scale, multi- The main outcome variable for this study is “marital
round survey conducted on a representative sample of dissolution.” Considering the lack of direct questions in the
households across India. The 2019 – 21 NFHS comprised NFHS to measure marital dissolution, we have utilized the
636,699 households, 724,115 women aged 15 – 49 years, information on current marital status, which was actually
and 101,839 men aged 15 – 54 years. The survey provides categorized as never-married, currently married/living with
state and national information for India on fertility, infant a partner, widowed, divorced, and separated. We excluded
and child mortality, family planning practices, maternal women who have never been married or in a union, as our
and child health, reproductive health, nutrition, anemia, focus was on patterns of union status among ever-married
and the utilization and quality of health and family women. In addition, we filtered out our sample by excluding
planning services. The data provide information for women who married once and whose marital status is
707 districts, 28 states, and eight union territories (UTs). widowed among the ever-married women. For the analysis,
Employing a stratified, two-stage sampling design and the we classified women who were married and living together
survey encompasses 30,198 primary sampling units. In with a partner as “0,” while those who were divorced and
the first stage, clusters were selected using a probability separated were collectively designated as “1.”
proportional to cluster size. In the second stage, 22
households from each cluster were selected with an equal 2.2.2. Explanatory variables
opportunity of systematic selection from the household With guidance from existing literature, this study identified
listing. A detailed description of the sampling procedure several explanatory variables encompassing demographic,
and survey design can be found in the India report of socio-economic, and fertility-related factors. These variables
NFHS-5 (International Institute for Population Sciences include birth cohort, current age of women, age at first
[IIPS] & ICF, 2021). All methods were carried out in cohabitation, social groups, religion, and place of residence.
accordance with relevant guidelines and regulations, with In addition, household wealth status, educational attainment,
informed consent obtained from all subjects and/or their and exposure to mass media were considered. Selected
legal guardian(s). The analysis for this study was based on a fertility characteristics, such as declared infecundity and the
subsample of ever-married women interviewed in NFHS-5 number of living sons, were also controlled for in the analysis.
surveys. A total of 511,604 ever-married women were
included in the analysis, after excluding women who were 2.3. Statistical analysis
never married (n = 181,285), widowed (n = 21,530), and
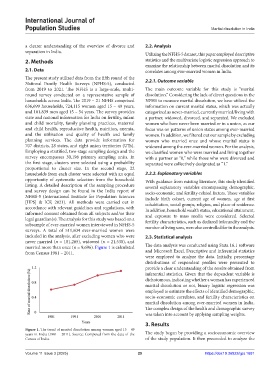
married more than once (n = 9,696). Figure 1 is calculated The data analysis was conducted using Stata 16.1 software
from Census 1981 – 2011. and Microsoft Excel. Descriptive and inferential statistics
were employed to analyze the data. Initially, percentage
distributions of respondent profiles were presented to
provide a clear understanding of the results obtained from
inferential statistics. Given that the dependent variable is
dichotomous, indicating whether a woman has experienced
marital dissolution or not, binary logistic regression was
employed to estimate the effects of identified demographic,
socio-economic correlates, and fertility characteristics on
marital dissolution among ever-married women in India.
The complex design of the health and demographic survey
was taken into account by applying sampling weights.
3. Results
Figure 1. The trend of marital dissolution among women aged 15 – 49
years in India (1981 – 2011). Source: Computed from the data of the The study began by providing a socioeconomic overview
Census of India. of the study population. It then proceeded to analyze the
Volume 11 Issue 3 (2025) 29 https://doi:10.36922/ijps.1681