Page 39 - IJPS-11-3
P. 39

International Journal of
            Population Studies                                                             Marital dissolution in India


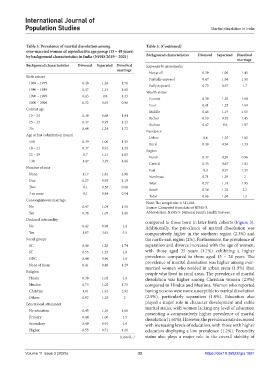
            Table 3. Prevalence of martial dissolution among   Table 3. (Continued)
            ever‑married women of reproductive age group (15 – 49 years)
            by background characteristics in India (NFHS 2019 – 2021)  Background characteristics  Divorced  Separated  Dissolved
                                                                                                      marriage
            Background characteristics  Divorced  Separated  Dissolved   Exposure to mass media
                                                   marriage
                                                                Not at all             0.39    1.06     1.45
            Birth cohort
                                                                Partially exposed      0.47    1.04     1.51
             1969 – 1979            0.48    1.28     1.76
                                                                Fully exposed          0.73    0.97     1.7
             1980 – 1989            0.47    1.14     1.61
                                                               Wealth status
             1990 – 1999            0.43     0.8     1.23
                                                                Poorest                0.39    1.29     1.68
             2000 – 2006            0.32    0.64     0.96
                                                                Poor                   0.41    1.23     1.64
            Current age
                                                                Middle                 0.46    1.19     1.65
             15 – 24                0.36    0.68     1.04
                                                                Richer                 0.53    0.92     1.45
             25 – 34                0.47    0.95     1.42
                                                                Richest                0.47     0.6     1.07
             35+                    0.48    1.24     1.72
                                                               Residence
            Age at first cohabitation (years)                   Urban                  0.6     1.25     1.85
             <18                    0.39    1.06     1.45
                                                                Rural                  0.39    0.94     1.33
             18 – 21                0.37    0.91     1.28
                                                               Region
             22 – 29                0.7     1.13     1.83
                                                                North                  0.37    0.59     0.96
             >30                    1.47    3.19     4.66
                                                                Central                0.35    0.67     1.02
            Number of sons
                                                                East                   0.3     0.91     1.21
             None                   1.17    1.81     2.98
                                                                Northeast              0.71    1.29      2
             One                    0.27    0.92     1.19
                                                                West                   0.77    1.18     1.95
             Two                    0.1     0.58     0.68
                                                                South                  0.54    1.76     2.3
             3 or more              0.1     0.44     0.54
                                                                Total                  0.46    1.04     1.5
            Consanguineous marriage
                                                               Note: The sample size is 511,604.
             No                     0.47    1.04     1.51      Source: Computed from data of NFHS-5.
             Yes                    0.36    1.05     1.41      Abbreviation: NFHS-5: National Family Health Surveys.
            Declared infecundity                               compared to those born in later birth cohorts (Figure 3).
             No                     0.42    0.98     1.4       Additionally,  the  prevalence  of  marital  dissolution  was
             Yes                    1.87    3.63     5.5       comparatively higher in the southern region (2.3%) and
            Social groups                                      the north-east region (2%). Furthermore, the prevalence of
             SC                     0.46    1.28     1.74      separation and divorce increased with the age of women;
             ST                     0.55    1.25     1.8       with those aged 35  years (1.7%) exhibiting a higher
                                                               prevalence compared to those  aged 15 –  24  years. The
             OBC                    0.44    0.96     1.4
             None of them           0.41    0.88     1.29      prevalence of marital dissolution was higher among ever-
                                                               married women who resided in urban areas (1.9%) than
            Religion                                           people who lived in rural areas. The prevalence of marital
             Hindu                  0.38    1.02     1.4       dissolution was higher among Christian women (2.9%)
             Muslim                 0.73    1.02     1.75      compared to Hindus and Muslims. Women who reported
             Christian              1.01    1.91     2.92      having no sons were more susceptible to marital dissolution
             Others                 0.82    1.18      2        (2.9%), particularly separation (1.8%). Education also
            Educational attainment                             played a major role in character development and stable
             No education           0.45    1.16     1.61      marital status, with women lacking any level of education
                                                               presenting a comparatively higher prevalence of marital
             Primary                0.44    1.06     1.5       dissolution (1.61%). However, the prevalence rate decreased
             Secondary              0.49    0.91     1.4       with increasing levels of education, with those with higher
             Higher                 0.55    0.71     1.26      education displaying a low prevalence (1.2%). Fecundity
                                                    (Cont’d...)  status also plays a major role in the overall stability of


            Volume 11 Issue 3 (2025)                        33                          https://doi:10.36922/ijps.1681
   34   35   36   37   38   39   40   41   42   43   44