
Page 37 - IJPS-11-3
P. 37
International Journal of
Population Studies Marital dissolution in India
belonged to the 1980 – 1989, 1990 – 1999, and 2000 – 2006 Table 2. Prevalence of marital dissolution among
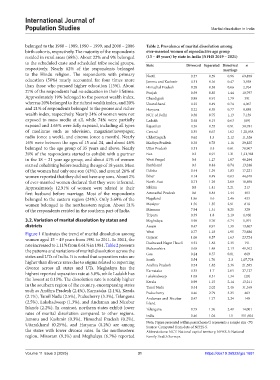
birth cohorts, respectively. The majority of the respondents ever‑married women of reproductive age group
resided in rural areas (68%). About 22% and 9% belonged (15 – 49 years) by state in India (NFHS 2019 – 2021)
to the scheduled caste and scheduled tribe social groups, State Divorced Separated Dissolved n
respectively. Nearly 82% of the respondents belonged marriage
to the Hindu religion. The respondents with primary North 0.37 0.59 0.96 69,858
education (58%) nearly accounted for four times more Jammu and Kashmir 0.31 0.16 0.47 3,938
than those who pursued higher education (13%). About Himachal Pradesh 0.28 0.38 0.66 2,764
27% of the respondents had no education in their lifetime. Punjab 0.59 0.85 1.44 10,797
Approximately 19% belonged to the poorest wealth index, Chandigarh 0.88 0.91 1.79 391
whereas 20% belonged to the richest wealth index, and 20% Uttarakhand 0.25 0.49 0.74 4,067
and 21% of respondents belonged to the poorer and richer Haryana 0.22 0.55 0.77 9,889
wealth index, respectively. Nearly 24% of women were not NCT of Delhi 0.38 0.75 1.13 7,159
exposed to mass media at all, while 74% were partially Ladakh 0.48 0.15 0.63 (69)
exposed and 1.65% were fully exposed, including all types Rajasthan 0.36 0.55 0.91 30,784
of mediums such as television, magazine/newspaper, Central 0.35 0.67 1.02 1,20,058
radio (once a week), and cinema (once a month). Nearly Chhattisgarh 0.62 1.5 2.12 11,326
16% were between the ages of 15 and 24, and about 46% Madhya Pradesh 0.38 0.78 1.16 29,825
belonged to the age group of 35 years and above. Nearly Uttar Pradesh 0.31 0.5 0.81 78,907
39% of the respondents started to cohabit with a partner East 0.3 0.91 1.21 1,21,381
in the 18 – 21 year age group, and about 41% of women West Bengal 0.4 1.27 1.67 46,244
started cohabiting before reaching the age of 18 years. Most Jharkhand 0.3 0.44 0.74 13,246
of the women had only one son (43%), and around 26% of Odisha 0.44 1.39 1.83 17,221
women reported that they did not have any sons. About 2% Bihar 0.14 0.49 0.63 44,670
of ever-married women declared that they were infecund. North-East 0.71 1.29 2.00 18,898
Approximately 12.91% of women were related to their Sikkim 0.8 1.41 2.21 213
first husband before marriage. Most of the respondents Arunachal Pradesh 0.6 0.84 1.44 403
belonged to the eastern region (24%). Only 3.69% of the Nagaland 1.86 0.6 2.46 433
women belonged to the northeastern region. About 21% Manipur 1.56 1.35 2.91 818
of the respondents resided in the southern part of India. Mizoram 7.94 1.31 9.25 329
Tripura 0.39 1.8 2.19 1,760
3.2. Variation of marital dissolution by states and Meghalaya 0.98 5.76 6.74 1,074
districts Assam 0.47 0.91 1.38 13,867
Figure 1 illustrates the trend of marital dissolution among West 0.77 1.18 1.95 73,686
women aged 15 – 49 years from 1981 to 2011. In 2011, the Gujarat 1.06 0.57 1.63 23,724
rate increased to 1.11% from 0.61% in 1981. Table 2 presents Dadra and Nagar Haveli 0.53 1.82 2.35 191
the patterns and variations of marital dissolution across the Maharashtra 0.65 1.48 2.13 49,102
669
states and UTs of India. It is noted that separation rates are Goa 0.24 0.57 0.81 1,07,724
1.76
2.3
South
0.54
higher than divorce rates due to stigma related to reporting Andhra Pradesh 0.54 1.82 2.36 21,585
divorce across all states and UTs. Meghalaya has the Karnataka 0.35 1.7 2.05 27,127
highest reported separation rate at 5.8%, while Ladakh has Lakshadweep 1.03 0.31 1.34 (29)
the lowest at 0.15%. The dissolution rate is notably higher Kerala 0.99 1.15 2.14 13,211
in the southern region of the country, encompassing states Tamil Nadu 0.44 2.02 2.46 31,168
such as Andhra Pradesh (2.4%), Karnataka (2.1%), Kerala Puducherry 0.46 2.79 3.25 463
(2.1%), Tamil Nadu (2.5%), Puducherry (3.3%), Telangana Andaman and Nicobar 0.47 1.77 2.24 140
(2.5%), Lakshadweep (1.3%), and Andaman and Nicobar Island
Islands (2.2%). In contrast, northern states exhibit lower Telangana 0.73 1.76 2.49 14,001
rates of marital dissolution compared to other regions. India 0.46 1.04 1.5 511,604
Jammu and Kashmir (0.3%), Himachal Pradesh (0.2%),
Uttarakhand (0.25%), and Haryana (0.2%) are among Note: Figure presented within parentheses/() represents a sample size <70.
Source: Computed from data of NFHS-5.
the states with lower divorce rates. In the northeastern Abbreviations: NCT: National capital territory, NFHS-5: National
region, Mizoram (9.3%) and Meghalaya (6.7%) reported Family Health Surveys.
Volume 11 Issue 3 (2025) 31 https://doi:10.36922/ijps.1681