Page 41 - IJPS-11-3
P. 41

International Journal of
            Population Studies                                                             Marital dissolution in India


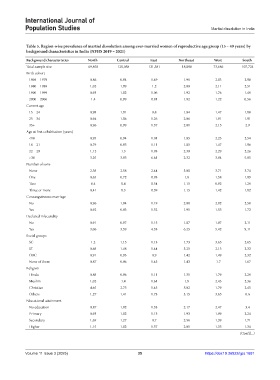
            Table 5. Region‑wise prevalence of martial dissolution among ever‑married women of reproductive age group (15 – 49 years) by
            background characteristics in India (NFHS 2019 – 2021)
            Background characteristics  North      Central       East        Northeast      West        South
            Total sample size          69,858      120,058      121,381       18,898        73,686      107,724
            Birth cohort
             1969 – 1979               0.86         0.94         1.49          1.98          2.03        2.98
             1980 – 1989               1.02         1.09          1.2          2.09          2.11        2.51
             1990 – 1999               0.93         1.02         1.06          1.92          1.76        1.49
             2000 – 2006                1.4         0.99         0.81          1.92          1.22        0.56
            Current age
             15 – 24                   0.98         1.01          0.8          1.84          1.47        1.08
             25 – 34                   0.94         1.06         1.26          2.06          1.91        1.91
             35+                       0.96         0.99         1.37          2.01          2.15        2.9
            Age at first cohabitation (years)
             <18                       0.95         0.94         1.01          1.85          2.23        2.54
             18 – 21                   0.79         0.95         1.11          1.85          1.47        1.96
             22 – 29                   1.12          1.3         1.93          2.39          2.29        2.26
             >30                       3.25         3.95         6.61          2.32          3.94        5.85
            Number of sons
             None                      2.38         2.58         2.44          3.00          3.71        3.74
             One                       0.65         0.72         0.93           1.8          1.58        1.89
             Two                        0.4          0.4         0.54          1.15          0.92        1.29
             Three or more             0.41          0.3         0.39          1.15          1.42        1.02
            Consanguineous marriage
             No                        0.96         1.04         1.19          2.00          2.02        2.50
             Yes                       0.92         0.83         1.32          1.91          1.55        1.72
            Declared infecundity
             No                        0.91         0.97         1.15          1.87          1.87        2.11
             Yes                       3.06         3.59         4.33          6.25          5.42        9.11
            Social groups
             SC                         1.2         1.15         1.13          1.73          3.65        2.65
             ST                        0.68         1.48         1.44          3.25          2.13        2.32
             OBC                       0.91         0.93          0.9          1.42          1.49        2.32
             None of them              0.87         0.86         1.45          1.43          1.7         1.67
            Religion
             Hindu                     0.88         0.96         1.11          1.31          1.79        2.29
             Muslim                    1.02          1.4         1.61           1.9          2.43        2.36
             Christian                 4.65         2.75         1.45          5.02          1.79        2.45
             Others                    1.27         1.41         1.73          3.15          3.65        0.6
            Educational attainment
             No education              0.87         1.02         1.33          2.17          2.47        3.4
             Primary                   0.93         1.02         1.13          1.93          1.99        2.24
             Secondary                 1.69         1.27          0.7          2.56          1.39        1.71
             Higher                    1.15         1.02         1.37          2.01          1.35        1.34
                                                                                                       (Cont’d...)


            Volume 11 Issue 3 (2025)                        35                          https://doi:10.36922/ijps.1681
   36   37   38   39   40   41   42   43   44   45   46