
Page 44 - IJPS-11-3
P. 44
International Journal of
Population Studies Marital dissolution in India
poorest individuals (OR = 2.625; 95% CI = 2.358 – 2.939) the northern (OR = 8.421; 95% CI = 5.294 – 13.397) and
faced the highest odds of marital dissolution, while richer western (OR = 8.191; 95% CI = 4.996 – 13.414) regions of
individuals (OR = 1.312; 95% CI = 1.198 – 1.436) and India.
those belonging to middle wealth status (OR = 1.772; 95%
CI = 1.614 – 1.945) exhibited lower risks compared to 4. Discussion
the poorest. This analysis indicates that women who live As per our knowledge, very few studies have been
in rural areas (OR = 0.611, 95% CI = 0.577 – 0.650) have conducted on the prevalence and risk factors of marital
significantly lower odds of experiencing marital dissolution dissolution in the Indian context, creating a knowledge
compared to those who live in urban areas. In terms of gap. This study aims to fill this gap by presenting estimates
spatial perspective, southern states (OR = 1.992, 95% of trends, prevalence, variability, and factors related to
CI = 1.824 – 2.177) and north-eastern states (OR = 1.811, marital dissolution in India. Indian family systems have
95% CI = 1.640 – 1.991) carry a higher risk of marital been changing as the country’s conventional marriage
dissolution compared to other states. unions slowly fade away, making room for western
Table 7 displays the findings of a region-based logistic family structures, including nucleation and cohabitation
regression on marital dissolution and its contributing (Dommaraju, 2016). The estimates show a fluctuating
factors. Women who possessed higher education than trend of divorce and separation starting from the base. The
their spouses (OR = 2.239; 95% CI = 1.829 – 2.741) widely acclaimed interdependence theory of relationships
were significantly associated with higher odds of marital (Thibaut & Kelley, 1959) provides a robust framework for
dissolution than women who were at the same level of comprehending the dynamics of marital dissolution. This
education as their husbands (OR = 1.45; 95% CI = 0.964 theory centers on the major balance of rewards and costs
– 1.363). The education gap between spouses has a within relationships, where rewards indicate pleasure while
significant impact on dissolution and is much more costs encompass adverse experiences. At the core of this
visible in the western and northern regions of India. theory lies the personal comparison level, a critical factor
Compared to women who work in non-agricultural that shapes expectations regarding relationship quality. The
sectors (OR = 3.099; 95% CI = 2.632 – 3.657), agricultural couple’s equilibrium can be destroyed for so many reasons,
employees (OR = 1.851; 95% CI = 0.431 – 0.607) are less at including compatibility issues due to an educational or
risk. Since women do not work, their risk is lower. Among age gap, financial problems, role conflicts, childlessness,
the respondents’ women (OR = 3.969; 95% CI = 3.429 and domestic violence (Jimenez Cabello et al., 2023). Our
– 4.597) who have experienced any type of violence by study’s findings illuminate the theory’s principles with
their spouses, they are very likely to experience marital real-world examples. Notably, we discovered that women
dissolution. Violence-driven divorce is more common in with higher levels of education tend to enjoy more stable
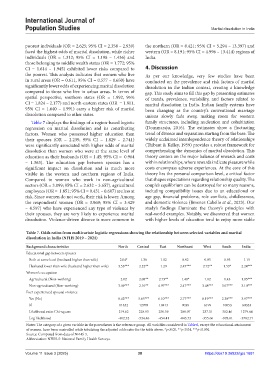
Table 7. Odds ratios from multivariate logistic regressions showing the relationship between selected variables and marital
dissolution in India (NFHS 2019 – 2021)
Background characteristics North Central East Northeast West South India
Educational gap between spouses
Both at same level (husband higher than wife) 2.04* 1.36 1.02 0.92 0.85 0.93 1.15
Husband lower than wife (husband higher than wife) 3.53*** 2.22** 1.29 2.45*** 2.72** 1.53* 2.24***
Women’s occupation
Agricultural (Non-working) 2.02 2.08** 2.73** 1.48* 1.02 1.43 1.85***
Non-agricultural (Non-working) 3.09*** 2.10** 4.97*** 2.47*** 3.48*** 3.07*** 3.10***
Ever experienced spousal violence
Yes (No) 8.42*** 5.65*** 6.10*** 2.77*** 8.19*** 2.30*** 3.97***
N 11652 12978 10413 9038 6199 10053 60333
Likelihood ratio Chi-square 219.62 228.93 250.59 208.07 237.31 302.46 1279.64
Log likelihood -402.32 -534.46 -454.41 -843.73 -355.66 -993.01 -3782.71
Notes: The category of a given variable in the parentheses is the reference group. All variables considered in Table 6, except the educational attainment
of women, have been controlled while tabulating the adjusted odds ratio for the table above. *p<0.05, **p<0.01, ***p<0.001.
Source: Computed from data of NFHS-5.
Abbreviation: NFHS-5: National Family Health Surveys.
Volume 11 Issue 3 (2025) 38 https://doi:10.36922/ijps.1681