
Page 43 - IJPS-11-3
P. 43
International Journal of
Population Studies Marital dissolution in India
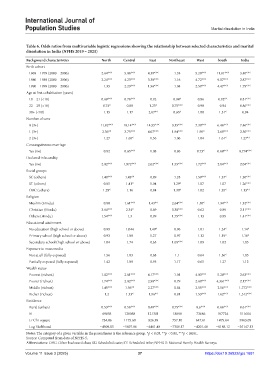
Table 6. Odds ratios from multivariable logistic regressions showing the relationship between selected characteristics and marital
dissolution in India (NFHS 2019 – 2021)
Background characteristics North Central East Northeast West South India
Birth cohort
1969 – 1979 (2000 – 2006) 2.64*** 5.06*** 4.39*** 1.33 5.20*** 11.01*** 3.40***
1980 – 1989 (2000 – 2006) 2.24*** 4.23*** 3.30*** 1.16 4.72*** 9.07*** 2.87***
1990 – 1999 (2000 – 2006) 1.35 2.23*** 1.96*** 1.04 2.58*** 4.47*** 1.79***
Age at first cohabitation (years)
18 – 21 (<18) 0.69*** 0.76*** 0.92 0.84* 0.86 0.82** 0.81***
22 – 29 (<18) 0.74* 0.88 1.23* 0.75*** 0.98 0.94 0.86***
30+ (<18) 1.15 1.17 2.07** 0.65* 1.08 1.51* 0.94
Number of sons
0 (3+) 11.02*** 18.14*** 14.55*** 3.35*** 7.38*** 6.46*** 7.46***
1 (3+) 2.36** 3.75*** 4.07*** 1.94*** 1.95* 2.69*** 2.50***
2 (3+) 1.27 1.68* 1.56 1.06 1.04 1.61* 1.27**
Consanguineous marriage
Yes (no) 0.82 0.65*** 1.08 0.86 0.73* 0.68*** 0.774***
Declared infecundity
Yes (no) 2.02*** 1.972*** 2.02*** 1.55*** 1.72*** 2.84*** 2.04***
Social groups
SC (others) 1.48*** 1.43** 0.89 1.28 1.59*** 1.37* 1.30***
ST (others) 0.85 1.41* 1.04 1.29* 1.07 1.07 1.26***
OBC (others) 1.29* 1.16 0.84 1.30* 1.02 1.35* 1.13**
Religion
Muslim (Hindu) 0.88 1.61*** 1.43** 2.64*** 1.50* 1.34*** 1.32***
Christian (Hindu) 3.64*** 2.34* 0.69 3.38*** 0.62 0.89 2.11***
Others (Hindu) 1.54*** 1.3 0.99 1.75*** 1.13 0.89 1.41***
Educational attainment
No education (high school or above) 0.99 1.044 1.49* 0.96 1.01 1.24* 1.14*
Primary school (high school or above) 0.93 1.08 1.27 0.97 1.12 1.19* 1.10*
Secondary school (high school or above) 1.04 1.74 0.65 1.05*** 1.09 1.02 1.05
Exposure to mass media
Not at all (fully exposed) 1.56 1.03 0.68 1.1 0.64 1.56* 1.05
Partially exposed (fully exposed) 1.42 1.09 0.93 1.17 0.65 1.27 1.12
Wealth status
Poorest (richest) 1.82*** 2.61*** 4.17*** 1.01 4.03*** 5.28*** 2.63***
Poorer (richest) 1.74*** 2.02*** 2.90*** 0.79 2.68*** 4.361*** 2.17***
Middle (richest) 1.45*** 1.56** 2.27*** 0.84 2.55*** 2.56*** 1.772***
Richer (richest) 1.2 1.33* 1.96** 0.81 1.53*** 1.62*** 1.312***
Residence
Rural (urban) 0.53*** 0.56*** 0.49*** 0.75*** 0.6*** 0.66*** 0.61***
N 69858 120058 121381 18898 73686 107724 511604
Lr Chi-square 734.86 1175.60 826.39 757.10 647.61 1479.64 5963.09
Log likelihood −4509.05 −5897.86 −4461.48 −7309.17 −4201.48 −8188.12 −35147.13
Notes: The category of a given variable in the parentheses is the reference group. *p < 0.05, **p < 0.01, ***p < 0.001.
Source: Computed from data of NFHS-5.
Abbreviations: OBC: Other backward class; SC: Scheduled caste; ST: Scheduled tribe; NFHS-5: National Family Health Surveys.
Volume 11 Issue 3 (2025) 37 https://doi:10.36922/ijps.1681