
Page 67 - IJPS-11-5
P. 67
International Journal of
Population Studies Atypical workers and COVID-19
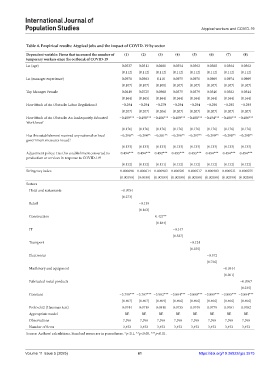
Table 4. Empirical results: Atypical jobs and the impact of COVID‑19 by sector
Dependent variable: Firms that increased the number of (1) (2) (3) (4) (5) (6) (7) (8)
temporary workers since the outbreak of COVID‑19
Ln (age) 0.0537 0.0511 0.0600 0.0554 0.0562 0.0588 0.0564 0.0562
(0.112) (0.112) (0.112) (0.112) (0.112) (0.112) (0.112) (0.112)
Ln (manager experience) 0.0970 0.0983 0.110 0.0975 0.0970 0.0989 0.0974 0.0989
(0.107) (0.107) (0.108) (0.107) (0.107) (0.107) (0.107) (0.107)
Top Manager Female 0.0619 0.0725 0.0988 0.0575 0.0579 0.0546 0.0582 0.0544
(0.164) (0.165) (0.164) (0.164) (0.164) (0.164) (0.164) (0.164)
How Much of An Obstacle: Labor Regulations? −0.294 −0.294 −0.279 −0.294 −0.294 −0.290 −0.292 −0.293
(0.207) (0.207) (0.206) (0.207) (0.207) (0.207) (0.207) (0.207)
How Much of An Obstacle: An Inadequately Educated −0.489*** −0.498*** −0.486*** −0.489*** −0.488*** −0.494*** −0.488*** −0.486***
Workforce?
(0.176) (0.176) (0.176) (0.176) (0.176) (0.176) (0.176) (0.176)
Has this establishment received any national or local −0.296** −0.294** −0.301** −0.296** −0.297** −0.299** −0.298** −0.298**
government measures issued?
(0.133) (0.133) (0.133) (0.133) (0.133) (0.133) (0.133) (0.133)
Adjustment policy: Has this establishment converted its 0.494*** 0.494*** 0.492*** 0.493*** 0.493*** 0.494*** 0.494*** 0.494***
production or services in response to COVID-19?
(0.132) (0.132) (0.131) (0.132) (0.132) (0.132) (0.132) (0.132)
Stringency index 0.000698 0.000614 0.000903 0.000581 0.000517 0.000483 0.000531 0.000555
(0.00390) (0.0038) (0.00389) (0.00388) (0.00388) (0.00388) (0.00390) (0.00388)
Sectors
Hotel and restaurants −0.0754
(0.273)
Retail −0.139
(0.162)
Construction 0.427**
(0.184)
IT −0.147
(0.527)
Transport −0.124
(0.355)
Electronics −0.572
(0.736)
Machinery and equipment −0.0444
(0.301)
Fabricated metal products −0.0767
(0.235)
Constant −3.798*** −3.767*** −3.902*** −3.804*** −3.800*** −3.809*** −3.805*** −3.804***
(0.407) (0.407) (0.409) (0.406) (0.406) (0.406) (0.406) (0.406)
Prob>chi2 (Hausman test) 0.0744 0.0719 0.0810 0.0735 0.0749 0.0779 0.0761 0.0762
Appropriate model RE RE RE RE RE RE RE RE
Observations 7,396 7,396 7,396 7,396 7,396 7,396 7,396 7,396
Number of firms 3,452 3,452 3,452 3,452 3,452 3,452 3,452 3,452
Source: Authors’ calculations. Standard errors are in parentheses. *p<0.1, **p<0.05, ***p<0.01.
Volume 11 Issue 5 (2025) 61 https://doi.org/10.36922/ijps.3575