
Page 101 - IJPS-2-1
P. 101
Sanjit Sarkar
3.4 Mother’s BMI and Child’s Malnutrition
Another important factor influencing child malnutrition or anthropometric outcomes is the mother’s
2
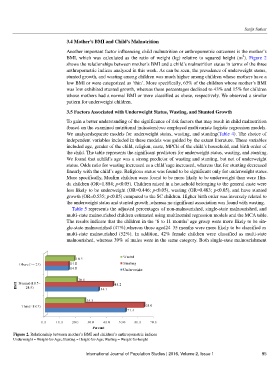
BMI, which was calculated as the ratio of weight (kg) relative to squared height (m ). Figure 2
shows the relationships between mother’s BMI and a child’s malnutrition status in terms of the three
anthropometric indices analyzed in this work. As can be seen, the prevalence of underweight status,
stunted growth, and wasting among children was much higher among children whose mothers have a
low BMI or were categorized as ‘thin’. More specifically, 63% of the children whose mother’s BMI
was low exhibited stunted growth, whereas these percentages declined to 43% and 15% for children
whose mothers had a normal BMI or were classified as obese, respectively. We observed a similar
pattern for underweight children.
3.5 Factors Associated with Underweight Status, Wasting, and Stunted Growth
To gain a better understanding of the significance of risk factors that may result in child malnutrition
(based on the examined nutritional indicators);we employed multivariate logistic regression models.
We analyzedseparate models for underweight status, wasting, and stunting(Table 4). The choice of
independent variables included in these models was guided by the extant literature. These variables
included age, gender of the child, religion, caste, MPCE of the child’s household, and birth order of
the child. The table represents the significant predictors for underweight status, wasting, and stunting.
We found that achild’s age was a strong predictor of wasting and stunting, but not of underweight
status. Odds ratio for wasting increased as a child’sage increased, whereas that for stunting decreased
linearly with the child’s age. Religious status was found to be significant only for underweight status.
More specifically, Muslim children were found to be more likely to be underweight than were Hin-
du children (OR=1.884; p<0.05). Children raised in a household belonging to the general caste were
less likely to be underweight (OR=0.446; p<0.05), wasting (OR=0.483; p<0.05), and have stunted
growth (OR=0.535; p<0.05) compared to the SC children. Higher birth order was inversely related to
the underweight status and stunted growth ,whereas no significant association was found with wasting.
Table 5 represents the adjusted percentages of non-malnourished, single-state malnourished, and
multi-state malnourished children estimated using multinomial regression models and the MCA table.
The results indicate that the children in the ‘6 to 11 months’ age group were more likely to be sin-
gle-state malnourished (47%),whereas those aged24−35 months were more likely to be classified as
multi-state malnourished (52%). In addition, 42% female children were classified as multi-state
malnourished, whereas 39% of males were in the same category. Both single-state malnourishment
Figure 2. Relationship between mother’s BMI and children’s anthropometric indices
Underweight = Weight-for-Age; Stunting = Height-for-Age; Wasting = Weight-for-height
International Journal of Population Studies | 2016, Volume 2, Issue 1 95