
Page 103 - IJPS-2-1
P. 103
Sanjit Sarkar
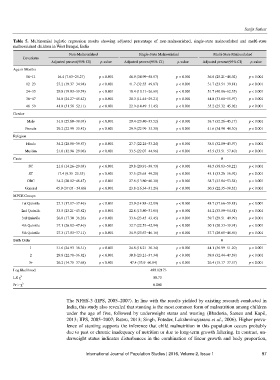
Table 5. Multinomial logistic regression results showing adjusted percentage of non-malnourished, single-state malnourished and multi-state
malnourished children in West Bengal, India
Non-Malnourished Single-State Malnourished Multi-State Malnourished
Covariates
Adjusted percent(95% CI) p-value Adjusted percent(95% CI) p-value Adjusted percent(95% CI) p-value
Age in Months
06−11 16.4 (7.63−25.27) p < 0.001 46.9 (34.99−58.87) p < 0.001 36.6 (25.21−48.02) p < 0.001
12−23 27.2 (19.37−34.94) p < 0.001 41.7 (32.55−49.87) p < 0.001 31.7 (23.54−39.81) p < 0.001
24−35 29.8 (19.93−39.74) p < 0.001 18.4 (10.11−26.69) p < 0.001 51.7 (40.96−62.55) p < 0.001
36−47 34.8 (24.27−45.42) p < 0.001 20.3 (11.44−29.21) p < 0.001 44.8 (33.68−55.97) p < 0.001
48−59 41.8 (31.58−52.11) p < 0.001 22.9 (14.49−31.45) p < 0.001 35.2 (25.32−45.02) p < 0.001
Gender
Male 31.8 (25.60−38.03) p < 0.001 29.4 (23.40−35.52) p < 0.001 38.7 (32.26−45.17) p < 0.001
Female 29.2 (22.99−35.42) p < 0.001 29.9 (22.99−35.38) p < 0.001 41.6 (34.90−48.30) p < 0.001
Religion
Hindu 34.2 (28.58−39.87) p < 0.001 27.7 (22.24−33.24) p < 0.001 38.0 (32.09−43.97) p < 0.001
Muslim 21.0 (12.96−29.08) p < 0.001 33.5 (22.07−44.96) p < 0.001 45.5 (33.51−57.40) p < 0.001
Caste 0
SC 21.6 (14.26−29.03) p < 0.001 29.8 (20.91−38.73) p < 0.001 48.5 (38.83−58.22) p < 0.001
ST 17.4 (9.35−25.53) p < 0.001 37.5 (25.65−49.28) p < 0.001 45.1 (33.26−56.92) p < 0.001
OBC 34.2 (20.02−48.47) p < 0.001 27.6 (13.80−40.30) p < 0.001 38.7 (23.84−53.54) p < 0.001
General 45.9 (37.05 - 54.66) p < 0.001 23.8 (16.34−31.26) p < 0.001 30.3 (22.35−38.32) p < 0.001
MPCE Groups
1st Quintile 27.3 (17.17−37.46) p < 0.001 23.9 (14.88−32.99) p < 0.001 48.7 (37.66−59.81) p < 0.001
2nd Quintile 33.5 (23.21−43.82) p < 0.001 22.8 (13.50−31.05) p < 0.001 44.2 (33.59−54.81) p < 0.001
3rd Quintile 26.8 (17.30−36.28) p < 0.001 33.6 (23.45−43.45) p < 0.001 39.7 (29.51−49.99) p < 0.001
4th Quintile 37.1 (26.82−47.46) p < 0.001 32.7 (22.53−42.94) p < 0.001 30.1 (20.33−39.91) p < 0.001
5th Quintile 27.3 (17.53−37.11) p < 0.001 34.9 (23.67−46.16) p < 0.001 37.7 (26.65−48.86) p < 0.001
Birth Order 0
1 31.6 (24.93−38.31) p < 0.001 24.8 (18.21−30.34) p < 0.001 44.1 (36.99−51.20) p < 0.001
2 29.8 (22.78−36.82) p < 0.001 30.8 (23.21−37.34) p < 0.001 39.9 (32.44−47.39) p < 0.001
3+ 26.2 (14.75−37.68) p < 0.001 47.4 (33.9−60.84) p < 0.001 26.4 (15.17−37.57) p < 0.001
Log likelihood –489.02173
2
LR χ 80.73
Pr > χ 2 0.000
The NFHS-3 (IIPS, 2005–2007). In line with the results yielded by existing research conducted in
India, this study also revealed that stunting is the most common form of malnutrition among children
under the age of five, followed by underweight status and wasting (Bhadoria, Sareen and Kapil,
2013; IIPS, 2005–2007; Ratnu, 2013; Singh, Foteder, Lakshminayarana et al., 2006). Higher preva-
lence of stunting supports the inference that child malnutrition in this population occurs probably
due to past or chronic inadequacy of nutrition or due to long-term growth faltering. In contrast, un-
derweight status indicates disturbances in the combination of linear growth and body proportion,
International Journal of Population Studies | 2016, Volume 2, Issue 1 97