
Page 102 - IJPS-2-1
P. 102
Cross-sectional study of child malnutrition and associated risk factors among children aged under five in West Bengal, India
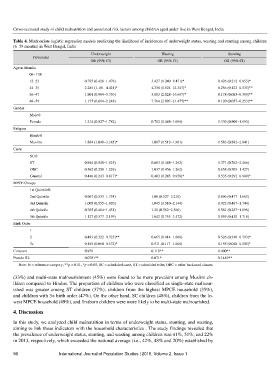
Table 4. Multivariate logistic regression models predicting the likelihood of incidences of underweight status, wasting and stunting among children
(6−59 months) in West Bengal, India
Underweight Wasting Stunting
Covariates
OR (95% CI) OR (95% CI) OR (95% CI)
Age in Months
06−11®
12−23 0.795 (0.428−1.476) 3.427 (1.240−9.471)* 0.426 (0.212−0.855)*
24−35 2.285 (1.181−4.421)* 4.338 (1.524−12.347)* 0.256 (0.123−0.535)**
36−47 1.901 (0.964−3.750) 5.803 (2.028−16.607)* 0.178 (0.083−0.380)**
48−59 1.175 (0.614−2.248) 7.764 (2.807−21.477)** 0.120 (0.057−0.253)**
Gender
Male®
Female 1.214 (0.827−1.782) 0.702 (0.448−1.099) 1.339 (0.900−1.993)
Religion
Hindu®
Muslim 1.884 (1.048−3.385)* 1.007 (0.512−1.981) 1.583 (0.882−2.841)
Caste
SC®
ST 0.944 (0.548−1.625) 0.663 (0.348−1.262) 1.371 (0.762−2.466)
OBC 0.562 (0.258−1.226) 1.037 (0.456−1.262) 0.658 (0.303−1.427)
General 0.446 (0.243−0.817)* 0.483 (0.243−0.958)* 0.535 (0.292−0.980)*
MPCE Groups
1st Quintile®
2nd Quintile 0.967 (0.533−1.754) 1.08 (0.527−2.210) 0.896 (0.477−1.685)
3rd Quintile 1.005 (0.555−1.820) 1.045 (0.510−2.144) 0.922 (0.487−1.744)
4th Quintile 0.765 (0.404−1.451) 1.20 (0.562−2.560) 0.561 (0.287−1.098)
5th Quintile 1.127 (0.577−2.199) 1.642 (0.755−3.572) 0.859 (0.430−1.718)
Birth Order
1
2 0.483 (0.322−0.725)** 0.665 (0.414−1.068) 0.526 (0.348−0.793)*
3+ 0.185 (0.060−0.572)* 0.511 (0.117−1.068) 0.155 (0.048−0.505)*
Constant 0.970 0.119** 6.400**
Pseudo R2 0.0781** 0.071* 0.1449**
Note: ® = reference category; **p < 0.01, *p < 0.05; SC = scheduled caste, ST = scheduled tribe; OBC = other backward classes
(33%) and multi-state malnourishment (45%) were found to be more prevalent among Muslim ch-
ildren compared to Hindus. The proportion of children who were classified as single-state malnour-
ished was greater among ST children (37%), children from the highest MPCE household (35%),
and children with 3+ birth order (47%). On the other hand, SC children (48%), children from the lo-
west MPCE household (49%), and firstborn children were more likely to be multi-state malnourished.
4. Discussion
In this study, we analyzed child malnutrition in terms of underweight status, stunting, and wasting,
aiming to link these indicators with the household characteristics . The study findings revealed that
the prevalence of underweight status, stunting, and wasting among children was 41%, 51%, and 22%
in 2013, respectively, which exceeded the national average (i.e., 42%, 48% and 20%) established by
96 International Journal of Population Studies | 2016, Volume 2, Issue 1