
Page 99 - IJPS-2-1
P. 99
Sanjit Sarkar
.4 .3
.3
.3
.2
.2
Density .2 Density Density
.1 .1
.1
0 0 0
-6 -4 -2 0 2 -10 -5 0 5 10 -10 -5 0 5 10
Weight for Age Height for Age Weight for Height
Weight for Age for Male Weight for Age for Female Height for Age for Male Height for Age for Female Weight for Height for Male Weight for Height for Female
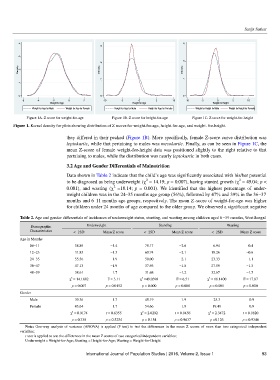
Figure 1A. Z score for weight-for-age Figure 1B. Z score for height-for-age Figure 1C. Z score for weight-for-height
Figure 1. Kernel density for plots showing distribution of Z scores for weight-for-age, height-for-age, and weight- for-height.
they differed in their peaked (Figure 1B). More specifically, female Z-score curve distribution was
leptokurtic, while that pertaining to males was mesokurtic. Finally, as can be seen in Figure 1C, the
mean Z-score of female weight-for-height data was positioned slightly to the right relative to that
pertaining to males, while the distribution was nearly leptokurtic in both cases.
3.2 Age and Gender Differentials of Malnutrition
Data shown in Table 2 indicate that the child’s age was significantly associated with his/her potential
2
2
to be diagnosed as being underweight (χ = 14.19; p = 0.007), having stunted growth (χ = 49.04; p <
2
0.001), and wasting (χ =18.14; p = 0.001). We identified that the highest percentage of under-
weight children was in the 24−35 months age group (56%), followed by 47% and 39% in the 36−37
months and 6−11 months age groups, respectively. The mean Z-score of weight-for-age was higher
for children under 24 months of age compared to the older group. We observed a significant negative
Table 2. Age and gender differentials of incidences of underweight status, stunting, and wasting among children aged 6−59 months, West Bengal
Demographic Underweight Stunting Wasting
Characteristics <−2SD Mean Z score <−2SD Mean Z score <−2SD Mean Z score
Age in Months
06−11 38.89 −1.4 79.17 −2.6 6.94 0.4
12−23 31.85 −1.5 60.74 −2.1 19.26 −0.6
24−35 55.56 −1.9 50.00 −2.1 23.33 −1.1
36−47 47.13 −1.9 37.93 −1.8 27.59 −1.3
48−59 38.61 –1.7 31.68 −1.2 32.67 −1.5
2
2
2
χ = 14.1882 F = 3.11 χ =49.0398 F = 6.51 χ = 18.1400 F = 17.87
p = 0.007 p = 0.0152 p = 0.000 p = 0.000 p = 0.001 p = 0.000
Gender
Male 39.36 −1.7 48.19 −1.9 25.3 −0.9
Female 43.64 −1.7 54.66 −1.9 19.49 −0.9
2
2
2
χ = 0.9174 t = 0.6355 χ = 2.0292 t = 0.0456 χ = 2.3472 t = 0.0820
p = 0.338 p = 0.5254 p = 0.154 p = 0.9637 p =0.126 p = 0.9346
Note: One-way analysis of variance (ANOVA) is applied (F test) to test the differences in the mean Z scores of more than two categorical independent
variables;
t-test is applied to test the differences in the mean Z scores of two categorical independent variables;
Underweight = Weight-for-Age; Stunting = Height-for-Age; Wasting = Weight-for-Height
International Journal of Population Studies | 2016, Volume 2, Issue 1 93