Page 118 - IJPS-2-1
P. 118

Dietary intake knowledge and reasons for food restriction during pregnancy among pregnant women attending primary health care centers in Ile-Ife, Nigeria

       sugary food (32.1%), salted food (23.4%), and ‘eba’ — a staple Nigerian food made from cassava
       flour (10.9%). Another major reason for avoiding food was because some of the  pregnant wom-
       en could not afford some food due to high costs. These foods were fruits (35.0%); ‘proteinous’ foods
       (30.0%) including eggs, ‘bushmeat’  (refers to  meats from non-domestic or wild animals), cray-
       fish, chicken; vegetables (7.2%); beverages (15.0%); and carbohydrates (12.8%).
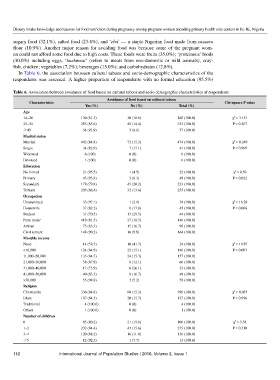
         In Table 6, the association between cultural taboos and socio-demographic characteristics of the
       respondents  was assessed. A higher proportion  of respondents with no formal education  (95.5%)

       Table 6. Association between avoidance of food based on cultural taboos and socio demographic characteristics of respondents
                                               Avoidance of food based on cultural taboos
              Characteristics                                                                    Chi-square P value
                                     Yes (%)             No (%)              Total (%)
           Age
           14–24                   130 (81.3)          30 (18.8)             160 (100.0)            χ = 3.151
                                                                                                     2
           25–34                   285 (85.6)          48 (14.4)             333 (100.0)            P = 0.207
           ≥45                      34 (91.9)           3 (8.1)              37 (100.0)
           Marital status
                                                                                                     2
           Married                 402 (84.8)          72 (15.2)             474 (100.0)            χ = 0.249
           Single                   34 (82.9)           7 (17.1)             41 (100.0)             P = 0.969
           Widowed                   6 (100)            0 (0)                 6 (100.0)
           Divorced                  1 (100)            0 (0)                 6 (100.0)
           Education
                                                                                                     2
           No formal                21 (95.5)           1 (4.5)              22 (100.0)             χ = 9.59
           Primary                  45 (93.8)           3 (6.3)              48 (100.0)             P = 0.022
           Secondary               178 (79.8)          45 (20.2)             223 (100.0)
           Tertiary                203 (86.4)          32 (13.6)             235 (100.0)
           Occupation
           Unemployed               33 (97.1)           1 (2.9)              34 (100.0)             χ = 16.28
                                                                                                     2
           Housewife                37 (82.2)           8 (17.8)             45 (100.0)             P = 0.006
           Student                  31 (70.5)          13 (29.5)             44 (100.0)
           Petty trader             119 (81.5)         27 (18.5)             146 (100.0)
           Artisan                  75 (83.3)          15 (16.7)             90 (100.0)
           Civil servant           148 (90.2)          16 (9.8)              164 (100.0)
           Monthly income
                                                                                                     2
           None                     14 (58.3)          10 (41.7)             24 (100.0)             χ = 19.87
           <10,000                 124 (84.9)          22 (15.1)             146 (100.0)            P = 0.003
           11,000–20,000           133 (84.7)          24 (15.3)             157 (100.0)
           21,000–30,000            58 (87.9)           8 (12.1)             66 (100.0)
           31,000–40,000            17 (73.9)           6 (26.1)             23 (100.0)
           41,000–50,000            40 (83.3)           8 (16.7)             48 (100.0)
           >50,000                  55 (94.8)           3 (5.2)              58 (100.0)
           Religion
           Christianity            336 (84.8)          60 (15.2)             396 (100.0)            χ = 0.055
                                                                                                     2
           Islam                   107 (84.3)          20 (15.7)             127 (100.0)            P = 0.996
           Traditional               4 (100.0)          0 (0)                 4 (100.0)
           Others                    1 (100.0)          0 (0)                 1 (100.0)
           Number of children
           0                        85 (80.2)          21 (19.8)             106 (100.0)            χ = 3.58
                                                                                                     2
           1–2                     232 (84.4)          43 (15.6)             275 (100.0)            P = 0.310
           3–4                     120 (88.2)          16 (11.8)             136 (100.0)
           ≥5                       12 (92.3)           1 (7.7)              13 (100.0)

       112                International Journal of Population Studies | 2016, Volume 2, Issue 1
   113   114   115   116   117   118   119   120   121   122   123