
Page 113 - IJPS-2-1
P. 113
Mattew O. Oluleke, Akintayo O. Ogunwale, Oyedunni S. Arulogun, et al
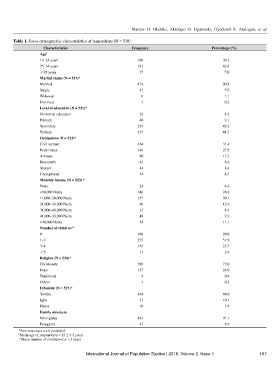
Table 1. Socio-demographic characteristics of respondents (N = 530)
Characteristics Frequency Percentage (%)
+
Age
14–24 years 160 30.2
25–34 years 333 62.8
≥35 years 37 7.0
Marital status (N = 521)*
Married 474 90.8
Single 41 7.9
Widowed 6 1.1
Divorced 1 0.2
Level of education (N = 521)*
No formal education 22 4.2
Primary 48 9.1
Secondary 223 42.2
Tertiary 235 44.5
Occupation (N = 523)*
Civil servant 164 31.4
Petty trader 146 27.9
Artisans 90 17.2
Housewife 45 8.6
Student 44 8.4
Unemployed 34 6.5
Monthly income (N = 523) *
None 24 4.6
<10,000 Naira 146 28.8
11,000–20,000 Naira 157 30.1
21,000–30,000 Naira 66 12.6
31,000–40,000 Naira 23 4.4
41,000–50,000 Naira 48 9.2
>50,000 Naira 58 11.1
++
Number of children
0 106 20.0
1–2 275 51.9
3–4 136 25.7
≥5 13 2.4
Religion (N = 528)*
Christianity 396 75.0
Islam 127 24.0
Traditional 4 0.8
Others 1 0.2
Ethnicity (N = 527)*
Yoruba 464 88.0
Igbo 53 10.1
Hausa 10 1.9
Family structure
Monogamy 483 91.1
Polygamy 47 8.9
*Non responses were excluded
+ Mean age of respondents = 27 ± 5.3 years
++ Mean number of children=2 ± 1.3 years
International Journal of Population Studies | 2016, Volume 2, Issue 1 107