
Page 115 - IJPS-2-1
P. 115
Mattew O. Oluleke, Akintayo O. Ogunwale, Oyedunni S. Arulogun, et al
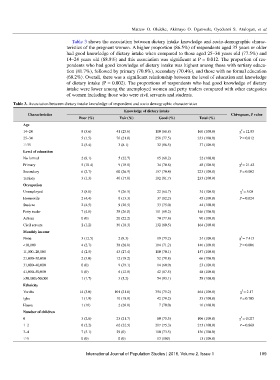
Table 3 shows the association between dietary intake knowledge and socio-demographic charac-
teristics of the pregnant women. A higher proportion (86.5%) of respondents aged 35 years or older
had good knowledge of dietary intake when compared to those aged 25–34 years old (77.5%) and
14–24 years old (68.8%) and this association was significant at P = 0.012. The proportion of res-
pondents who had good knowledge of dietary intake was highest among those with tertiary educa-
tion (81.7%), followed by primary (70.8%), secondary (70.4%), and those with no formal education
(68.2%). Overall, there was a significant relationship between the level of education and knowledge
of dietary intake (P = 0.002). The proportions of respondents who had good knowledge of dietary
intake were lower among the unemployed women and petty traders compared with other categories
of women including those who were civil servants and students.
Table 3. Association between dietary intake knowledge of respondent and socio demographic characteristics
Knowledge of dietary intake
Characteristics Chi-square, P value
Poor (%) Fair (%) Good (%) Total (%)
Age
2
14–24 9 (5.6) 41 (25.6) 110 (68.8) 160 (100.0) χ = 12.95
25–34 5 (1.5) 70 (21.0) 258 (77.5) 333 (100.0) P = 0.012
≥35 2 (5.4) 3 (8.1) 32 (86.5) 37 (100.0)
Level of education
No formal 2 (9.1) 5 (22.7) 15 (68.2) 22 (100.0)
2
Primary 5 (10.4) 9 (18.8) 34 (70.8) 48 (100.0) χ = 21.42
Secondary 6 (2.7) 60 (26.9) 157 (70.4) 223 (100.0) P = 0.002
Tertiary 3 (1.3) 40 (17.0) 192 (81.7) 235 (100.0)
Occupation
2
Unemployed 3 (8.8) 9 (26.5) 22 (64.7) 34 (100.0) χ = 5.08
Housewife 2 (4.4) 6 (13.3) 37 (82.2) 45 (100.0) P = 0.024
Student 2 (4.5) 9 (20.5) 33 (75.0) 44 (100.0)
Petty trader 7 (4.8) 38 (26.0) 101 (69.2) 146 (100.0)
Artisan 0 (0) 20 (22.2) 70 (77.8) 90 (100.0)
Civil servant 2 (1.2) 30 (18.3) 132 (80.5) 164 (100.0)
Monthly income
None 3 (12.5) 2 (8.3) 19 (79.2) 24 (100.0) χ = 7.415
2
<10,000 4 (2.7) 38 (26.0) 104 (71.2) 146 (100.0) P = 0.006
11,000–20,000 4 (2.5) 43 (27.4) 110 (70.1) 157 (100.0)
21,000–30,000 2 (3.0) 12 (18.2) 52 (78.8) 66 (100.0)
31,000–40,000 0 (0) 9 (39.1) 14 (60.9) 23 (100.0)
41,000–50,000 0 (0) 6 (12.5) 42 (87.5) 48 (100.0)
>50,000>50,000 1 (1.7) 3 (5.2) 54 (93.1) 58 (100.0)
Ethnicity
2
Yoruba 14 (3.0) 101 (21.8) 394 (75.2) 464 (100.0) χ = 2.17
Igbo 1 (1.9) 10 (18.9) 42 (79.2) 53 (100.0) P = 0.705
Hausa 1 (10) 2 (20.0) 7 (70.0) 10 (100.0)
Number of children
2
0 3 (2.8) 23 (21.7) 80 (75.5) 106 (100.0) χ = 0.027
1–2 6 (2.2) 62 (22.5) 207 (75.3) 275 (100.0) P = 0.869
3–4 7 (5.1) 29 (0) 100 (73.5) 136 (100.0)
≥5 0 (0) 0 (0) 13 (100) 13 (100.0)
International Journal of Population Studies | 2016, Volume 2, Issue 1 109