
Page 43 - IJPS-2-1
P. 43
Bruno Yempabou Lankoande
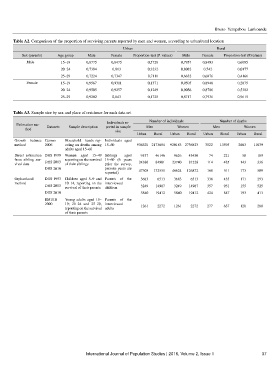
Table A2. Comparison of the proportion of surviving parents reported by men and women, according to urban/rural location
Urban Rural
Sex (parents) Age group Male Female Proportion-test (P. values) Male Female Proportion-test (P.values)
Male 15–19 0,8775 0,8475 0,5728 0,7957 0,8493 0,6095
20–24 0,7384 0,813 0,3232 0,8082 0,742 0,0177
25–29 0,7224 0,7347 0,7111 0,6632 0,6876 0,4166
Female 15–19 0,9567 0,9311 0,1371 0,9505 0,8948 0,2875
20–24 0,9505 0,9257 0,1249 0,9056 0,8786 0,5382
25–29 0,9202 0,843 0,1725 0,8717 0,7936 0,9615
Table A3. Sample size by sex and place of residence for each data set
Number of individuals
Individuals re-
Estimation me- Datasets Sample description ported in sample Men Women Men Number of deaths
Women
thod size
Urban Rural Urban Rural Urban Rural Urban Rural
Growth balance Census Household heads rep- Individuals aged
method 2006 orting on deaths among 15–60 936320 2173654 920183 2736823 3522 13595 2663 11039
adults aged 15–60
Direct estimation DHS 1999 Women aged 15–49 Siblings aged 9537 46146 9626 43430 74 221 58 189
from sibling sur- reporting on the survival 15–60 (6 years
vival data DHS 2003 of their siblings prior the survey, 24386 84901 23740 81228 114 485 143 336
DHS 2010 persons years are 47305 132551 46624 126872 169 511 173 509
reported)
Orphanhood DHS 1993 Children aged 5–9 and Parents of the 3683 6513 3683 6513 338 455 171 293
method 10–14, reporting on the interviewed
DHS 2003 survival of their parents children 3249 14987 3249 14987 357 951 155 525
DHS 2010 5840 19412 5840 19412 424 847 193 413
EMUIB Young adults aged 15– Parents of the
2000 19; 20–24 and 25–29, interviewed 1261 2272 1261 2272 277 637 120 280
reporting on the survival adults
of their parents
International Journal of Population Studies | 2016, Volume 2, Issue 1 37