Page 134 - IJPS-2-2
P. 134

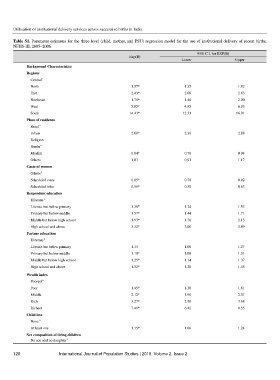
Utilization of institutional delivery services across successive births in India

       Table S1. Parameter estimates for the three-level (child, mother, and PSU) regression model for the use of institutional delivery of recent births,
       NFHS-III, 2005–2006.
                                                                                     95% C.I. for EXP(B)
                                                        Exp(B)
                                                                              Lower                  Upper
            Background Characteristics
            Regions
              Central   a
              North                                      1.57*                  1.35                  1.82
              East                                       2.43*                  2.08                  2.83
              Northeast                                  1.71*                  1.46                  2.00
              West                                       5.85*                  4.95                  6.93
              South                                     14.43*                 12.31                 16.91
            Place of residence
                   a
              Rural
              Urban                                      2.60*                  2.36                  2.88
              Religion
                   a
              Hindu
              Muslim                                     0.84*                  0.76                  0.94
              Others                                     1.03                   0.91                  1.17
            Caste of women
                   a
              Others
              Scheduled caste                            0.85*                  0.78                  0.92
              Scheduled tribe                            0.56*                  0.50                  0.63
            Respondent education
                    a
              Illiterate
              Literate but below primary                 1.38*                  1.24                  1.53
              Primary but below middle                   1.57*                  1.44                  1.71
              Middle but below high school               1.93*                  1.76                  2.13
              High school and above                      3.33*                  3.00                  3.69
            Partner education
                    a
              Illiterate
              Literate but below primary                 1.13                   1.00                  1.27
              Primary but below middle                   1.19*                  1.08                  1.31
              Middle but below high school               1.25*                  1.14                  1.37
              High school and above                      1.32*                  1.20                  1.45
            Wealth index
              Poorest
                    a
              Poor                                       1.45*                  1.30                  1.61
              Middle                                     2.12*                  1.90                  2.37
              Rich                                       3.27*                  2.90                  3.68
              Richest                                    7.41*                  6.42                  8.55
            Child loss
                   a
              None
              At least one                               1.15*                  1.06                  1.24
            Sex composition of living children
                              a
              No son and no daughter
       128                International Journal of Population Studies | 2016, Volume 2, Issue 2
   129   130   131   132   133   134   135   136   137   138   139