
Page 136 - IJPS-2-2
P. 136
Utilization of institutional delivery services across successive births in India
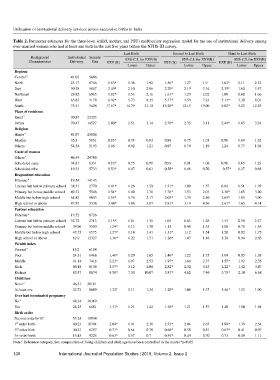
Table 2. Parameter estimates for the three-level (child, mother, and PSU) multivariate regression model for the use of institutional delivery among
ever-married women who had at least one birth in the last five years before the NFHS-III survey.
Last Birth Second to Last Birth Third to Last Birth
Background Institutional Sample
Characteristics Delivery Size EXP (B) 95% C.I. for EXP(B) EXP (B) 95% C.I. for EXP(B) EXP (B) 95% C.I. for EXP(B)
Lower Upper Lower Upper Lower Upper
Regions
Central 41.03 5686
a
North 23.17 8746 1.63* 1.38 1.92 1.56* 1.27 1.9 1.61* 1.11 2.32
East 30.38 5847 2.49* 2.10 2.96 2.70* 2.19 3.34 2.39* 1.60 3.57
Northeast 29.82 6965 1.82* 1.53 2.16 1.61* 1.29 2.02 1.00 0.60 1.66
West 63.83 4178 6.92* 5.73 8.35 5.77* 4.59 7.24 5.14* 3.30 8.01
South 75.31 5428 17.67* 14.79 21.12 15.20* 12.15 19.00 8.02* 5.25 12.25
Place of residence
a
Rural 30.87 22323
Urban 70.47 14527 2.80* 2.51 3.14 2.70* 2.35 3.11 2.44* 1.85 3.24
Religion
Hindu 41.97 25806
a
Muslim 35.3 5851 0.83* 0.74 0.93 0.88 0.75 1.03 0.96 0.69 1.32
Others 54.54 5193 1.06 0.92 1.21 0.97 0.79 1.19 1.24 0.77 1.98
Caste of women
a
Others 46.34 24786
Scheduled caste 34.81 6331 0.83* 0.75 0.90 0.93 0.81 1.06 0.90 0.65 1.23
Scheduled tribe 19.33 5733 0.53* 0.47 0.61 0.58* 0.48 0.70 0.57* 0.37 0.88
Respondent education
a
Illiterate 19.54 14143
Literate but below primary school 38.31 2770 1.41* 1.26 1.59 1.31* 1.09 1.57 0.84 0.51 1.39
Primary but below middle school 49.32 5546 1.54* 1.40 1.70 1.76* 1.53 2.03 2.30* 1.65 3.20
Middle but below high school 64.83 9053 1.95* 1.76 2.17 2.05* 1.75 2.40 2.65* 1.80 3.90
High school or above 87.87 5338 3.44* 3.06 3.87 3.81* 3.19 4.56 2.61* 1.65 4.14
Partner education
a
Illiterate 19.52 8726
Literate but below primary school 32.72 2713 1.15* 1.01 1.31 1.04 0.85 1.28 1.43 0.90 2.27
Primary but below middle school 39.96 5509 1.24* 1.12 1.38 1.15 0.98 1.35 1.08 0.75 1.55
Middle but below high school 43.75 6575 1.27* 1.14 1.41 1.31* 1.12 1.54 1.20 0.82 1.75
High school or above 62.9 13327 1.36* 1.22 1.51 1.26* 1.07 1.48 1.38 0.94 2.03
Wealth index
a
Poorest 13.2 6154
Poor 24.31 6468 1.46* 1.29 1.65 1.46* 1.22 1.75 1.09 0.85 1.38
Middle 41.14 7418 2.23* 1.97 2.52 1.97* 1.64 2.37 1.55* 1.02 2.35
Rich 60.18 8136 3.57* 3.12 4.08 2.82* 2.32 3.43 2.22* 1.42 3.47
Richest 85.57 8674 8.58* 7.30 10.07 5.87* 4.62 7.46 3.75* 2.10 6.68
Child loss
None 46.31 30161
a
At least one 23.73 6689 1.22* 1.11 1.34 1.20* 1.06 1.37 1.46* 1.12 1.90
Ever had terminated pregnancy
a
No 48.34 30369
Yes 26.25 6481 1.31* 1.21 1.42 1.38* 1.21 1.57 1.40 1.00 1.94
Birth order
Second order birth a 55.24 10934
1 order birth 60.23 10394 2.09* 1.91 2.30 2.33* 2.06 2.65 1.88* 1.39 2.54
st
rd
3 order birth 30.21 6297 0.71* 0.64 0.78 0.68* 0.58 0.81 0.63* 0.41 0.97
3+ order birth 15.45 9225 0.63* 0.57 0.7 0.59* 0.49 0.70 0.73 0.49 1.11
a
Note: Reference category, Sex composition of living children and child age have been controlled in the model *p<0.05
130 International Journal of Population Studies | 2016, Volume 2, Issue 2