Page 135 - IJPS-2-2
P. 135

Priyanka Dixit and Laxmi Kant Dwivedi

                                                                                                           Continued
                                                                                     95% C.I. for EXP(B)
                                                     Exp(B)
                                                                              Lower                  Upper
              No. of sons greater than daughters   1.11                        0.84                   1.47
              No. of sons less than daughters      1.09                        0.83                   1.44
              Equal sons and daughters             1.06                        0.80                   1.40
            Ever had terminated pregnancy

              No   a
              Yes                                  1.34*                       1.24                   1.44
            Child age (in months)
                   a
              0 - 23
              24 - 35                              0.89*                       0.83                   0.96
              36 - 47                              0.73*                       0.68                   0.78
              48 - 59                              0.67*                       0.63                   0.72
            Birth order
                       a
               nd
              2 order birth
               st
              1 order birth                        1.92*                       1.79                   2.05
              3  order birth                       0.74*                       0.68                   0.80
               rd
              3+ order birth                       0.67*                       0.62                   0.74
            Constant                               0.06*                       0.04                   0.08
            Random Effects                                           Coefficient (Standard Error)
              Level 3 (PSU Level)                                         1.119 (0.045)
              Level 2 (Mother Level)                                      0.557 (0.043)
          a
       Note:  Reference category.*p<0.05

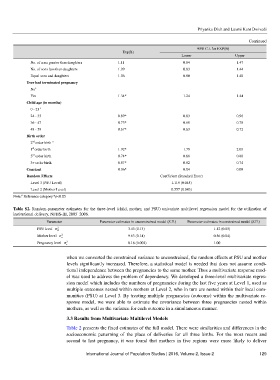
       Table S2. Random-parameter estimates for the three-level (child, mother, and PSU) univariate multilevel regression model for the utilization of
       institutional delivery, NFHS-III, 2005–2006.
                     Parameter              Parameter estimates in unconstrained model (S.E.)   Parameter estimates in constrained model (S.E.)
                          2
                 PSU level  σ                          3.43 (0.13)                          1.12 (0.05)
                         ϑ
                           2
                 Mother level  σ                       9.63 (0.14)                          0.56 (0.04)
                           u
                             2
                 Pregnancy level  σ                    0.16 (0.002)                         1.00
                             e

                             when we converted the constrained variance to unconstrained, the random effects at PSU and mother
                             levels significantly increased. Therefore, a statistical model is needed that does not assume condi-
                             tional independence between the pregnancies to the same mother. Thus a multivariate response mod-
                             el was used to address the problem of dependency. We developed a three-level multivariate regres-
                             sion model which includes the numbers of pregnancies during the last five years at Level 1, used as
                             multiple outcomes nested within mothers at Level 2, who in turn are nested within their local com-
                             munities (PSU) at Level 3. By treating multiple pregnancies (outcome) within the multivariate re-
                             sponse model,  we were able to  estimate  the covariance between three  pregnancies  nested within
                             mothers, as well as the variance for each outcome in a simultaneous manner.

                             3.3 Results from Multivariate Multilevel Models
                             Table 2 presents the fixed estimates of the full model. There were similarities and differences in the
                             socioeconomic  patterning  of the  place  of deliveries  for  all three  births. For  the  most recent and
                             second  to last  pregnancy,  it was found that mothers in five regions were  more likely to deliver

                                      International Journal of Population Studies | 2016, Volume 2, Issue 2    129
   130   131   132   133   134   135   136   137   138   139   140