
Page 97 - IJPS-2-2
P. 97
Haiyan Zhu, Qiushi Feng, and Danan Gu
Appendix
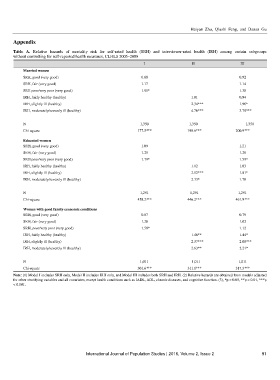
Table A. Relative hazards of mortality risk for self-rated health (SRH) and interviewer-rated health (IRH) among certain subgroups
without controlling for self-reported health measures, CLHLS 2005–2008
I II III
Married women
SRH, good (very good) 0.88 0.92
SRH, fair (very good) 1.17 1.14
SRH poor/very poor (very good) 1.91* 1.30
IRH, fairly healthy (healthy) 1.01 0.94
IRH, slightly ill (healthy) 2.34*** 1.96*
IRH, moderately/severely ill (healthy) 4.76*** 3.79***
N 1,350 1,350 1,350
Chi-square 177.5*** 198.6*** 200.9***
Educated women
SRH, good (very good) 1.09 1.21
SRH, fair (very good) 1.25 1.29
SRH poor/very poor (very good) 1.79* 1.59*
IRH, fairly healthy (healthy) 1.12 1.03
IRH, slightly ill (healthy) 2.12*** 1.81*
IRH, moderately/severely ill (healthy) 2.33* 1.78
N 1,291 1,291 1,291
Chi-square 458.2*** 446.2*** 461.9***
Women with good family economic conditions
SRH, good (very good) 0.87 0.79
SRH, fair (very good) 1.26 1.02
SRH, poor/very poor (very good) 1.58* 1.12
IRH, fairly healthy (healthy) 1.46** 1.44*
IRH, slightly ill (healthy) 2.37*** 2.08***
IRH, moderately/severely ill (healthy) 2.63** 2.21*
N 1,011 1,011 1,011
Chi-square 301.6*** 311.1*** 317.3***
Note: (1) Model I includes SRH only, Model II includes IRH only, and Model III includes both SRH and IRH. (2) Relative hazards are obtained from models adjusted
for other stratifying variables and all covariates, except health conditions such as IADL, ADL, chronic diseases, and cognitive function. (3), *p < 0.05, **p < 0.01, ***p
< 0.001.
International Journal of Population Studies | 2016, Volume 2, Issue 2 91