
Page 98 - IJPS-3-1
P. 98
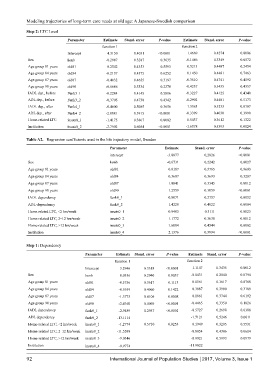
Modeling trajectories of long-term care needs at old age: A Japanese-Swedish comparison

            Step 2: LTC Level
                              Parameter      Estimate  Stand. error  P-value   Estimate  Stand. error  P-value
                                             function 1                        function 2
                              Intercept        4.3150     0.4031     <0.0001     1.4669     0.4274      0.0006
             Sex              konb            -0.2987     0.3287       0.3635   -0.1486     0.3349      0.6572
             Age group 81 years   old81        0.2542     0.4353       0.5593    0.5213     0.4487      0.2454
             Age group 84 years   old84       -0.2137     0.4375       0.6252    0.1450     0.4481      0.7463
             Age group 87 years   old87       -0.4632     0.4655       0.3197   -0.3510     0.4741      0.4592
             Age group 90 years   old90       -0.6686     0.5534       0.2270   -0.4237     0.5435      0.4357
             IADL dep., before   Funk3_1      -0.2284     0.4145       0.5816   -0.3227     0.4125      0.4340
             ADL dep., before  Funk3_2        -0,3705     0.4738       0.4342   -0.2902     0.4481      0.5173
             IADL dep., after   Funk4_1       -0.4600     0.5085       0.3656    1.3363     0.5233      0.0107
             ADL dep., after  Funk4_2         -2.8081     0.3915     <0.0001    -0.3399     0.4030      0.3990
             Home-related LTC   insats0_1     -1.4175     0.3867       0.0002    0.5437     0.3612      0.1322
             Institution      insats0_2       -2.7502     0.6054     <0.0001    -1.6378     0.5393      0.0024

            Table A2.   Regression coefficients used in the life trajectory model, Sweden

                                                Parameter              Estimate     Stand. error       P-value
                                                intercept               -3.0877         0,2826         <0.0001
             Sex                                konb                    -0.6731         0.2242          0.0027
             Age group 81 years                 old81                    0.0187         0.3765          0.9603
             Age group 84 years                 old84                    0.3607         0.3693          0.3287
             Age group 87 years                 old87                    1.0841         0.3345          0.0012
             Age group 90 years                 old90                    1.2559         0.3059         <0.0001
             IADL dependency                    funk0_1                  0.8071         0.2737          0.0032
             ADL-dependency                     funk0_2                  1.4220         0.4022          0.0004
             Home related LTC, <2 hrs/week      insats0_1                0.9483         0.3111          0.0023
             Home-related LTC, 2–12 hrs/week    insats0_2                1.1772         0.3630          0.0012
             Home-related LTC, >12 hrs/week     insats0_3                1.6884         0.4544          0.0002
             Institution                        insats0_4                2.1376         0.3994         <0.0001

            Step 1: Dependency

                                     Parameter     Estimate  Stand. error  P-value   Estimate  Stand. error  P-value
                                                  function 1                      function 2
                                     Intercept       3.2946   0.3318    <0.0001      1.1147  0.3435     0.0012
             Sex                     konb            0.0356   0.2940      0.9037    -0.0431  0.2840     0.8794
             Age group 81 years      old81          -0.5756   0.3617      0.1113     0.0561  0.3617     0.8768
             Age group 84 years      old84          -0.5959   0.4060      0.1422     0.3887   0.3900    0.3189
             Age group 87 years      old87          -1.3775   0.4106      0.0008     0.1861  0.3744     0.6192
             Age group 90 years      old90          -2.4160   0.4069    <0.0001     -0.4465  0.3350     0.1826
             IADL dependency         funk0_1        -2.9489   0.2957    <0.0001     -0.5727  0.2698     0.0388
             ADL dependency          funk0_2       -13.1114                         -1.7121  0.5246     0.0011
             Home-related LTC, <2 hrs/week  insats0_1  -1.2774  0.5710    0.0253     0.1949  0.3285     0.5531
             Home-related LTC, 2–12 hrs/week  insats0_2  -11.5588                   -0.8054  0.4306     0.0614
             Home-related LTC, >12 hrs/week   insats0_3  -9.0346                    -0.9921  0.5993     0.0979
             Institution             insats0_4      -9.9774                       -11.9022

            92                                  International Journal of Population Studies   2017, Volume 3, Issue 1