
Page 94 - IJPS-3-1
P. 94
Modeling trajectories of long-term care needs at old age: A Japanese-Swedish comparison
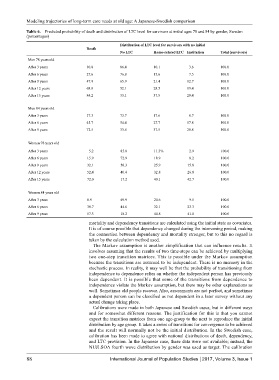
Table 6. Predicted probability of death and distribution of LTC level for survivors at initial ages 78 and 84 by gender, Sweden
(percentages)
Distribution of LTC level for survivors with no initial
Death
No LTC Home-related LTC Institution Total (survivors)
Men 78 years old
After 3 years 10.0 86.4 10.1 3.6 100.0
After 6 years 27.6 76.8 15.6 7.5 100.0
After 9 years 47.9 65.9 21.4 12.7 100.0
After 12 years 68.0 52.1 28.5 19.4 100.0
After 15 years 84.2 33.1 37.5 29.4 100.0
Men 84 years old
After 3 years 17.3 73.7 17.6 8.7 100.0
After 6 years 45.7 54.4 27.7 17.8 100.0
After 9 years 72.5 33.6 37.5 28.8 100.0
Women 78 years old
After 3 years 5.2 85.8 11.3% 2.9 100.0
After 6 years 15.9 72.9 18.9 8.2 100.0
After 9 years 32.1 58.3 25.9 15.8 100.0
After 12 years 52.4 40.4 32.8 26.8 100.0
After 15 years 72.0 17.2 40.1 42.7 100.0
Women 84 years old
After 3 years 8.9 69.9 20.6 9.5 100.0
After 6 years 30.7 44.6 32.1 23.3 100.0
After 9 years 57.3 18.2 40.8 41.0 100.0
mortality and dependency transitions are calculated using the initial state as covariates.
It is of course possible that dependency changed during the intervening period, making
the connection between dependency and mortality stronger, but to this no regard is
taken by the calculation method used.
The Markov assumption is another simplification that can influence results. It
involves assuming that the results of two time-steps can be achieved by multiplying
two one-step transition matrices. This is possible under the Markov assumption
because the transitions are assumed to be independent. There is no memory in the
stochastic process. In reality, it may well be that the probability of transitioning from
independence to dependence relies on whether the independent person has previously
been dependent. It is possible that some of the transitions from dependence to
independence violate the Markov assumption, but there may be other explanations as
well. Sometimes old people recover. Also, assessments are not perfect, and sometimes
a dependent person can be classified as not dependent in a later survey without any
actual change taking place.
Calibrations were made in both Japanese and Swedish cases, but in different ways
and for somewhat different reasons. The justification for this is that you cannot
expect the transition matrices from one age-group to the next to reproduce the initial
distribution by age group. It takes a series of transitions for convergence to be achieved
and the result will normally not be the initial distribution. In the Swedish case,
calibration has been made to agree with national distributions of death, dependency,
and LTC provision. In the Japanese case, these data were not available; instead, the
NUJLSOA fourth wave distribution by gender was used as target. The calibration
88 International Journal of Population Studies 2017, Volume 3, Issue 1