
Page 90 - IJPS-3-1
P. 90
Modeling trajectories of long-term care needs at old age: A Japanese-Swedish comparison
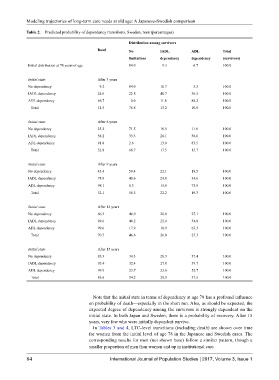
Table 2. Predicted probability of dependency transitions, Sweden, men (percentages)
Distribution among survivors
Dead No IADL ADL Total
limitations dependency dependency (survivors)
Initial distribution at 78 years of age 84.0 9.3 6.7 100.0
Initial state After 3 years
No dependency 9.2 84.0 10.7 5.3 100.0
IADL dependency 24.6 22.8 40.7 36.5 100.0
ADL dependency 66.7 0.0 11.8 88.2 100.0
Total 14.5 76.8 13.2 10.0 100.0
Initial state After 6 years
No dependency 25.2 71.5 16.9 11.6 100.0
IADL dependency 58.2 33.3 28.1 38.6 100.0
ADL dependency 91.8 2.6 13.9 83.5 100.0
Total 32.8 68.7 17.5 13.7 100.0
Initial state After 9 years
No dependency 45.4 59.4 22.1 18.5 100.0
IADL dependency 78.9 40.6 24.8 34.6 100.0
ADL dependency 98.1 8.3 15.8 75.9 100.0
Total 52.1 58.5 22.2 19.3 100.0
Initial state After 12 years
No dependency 66.3 46.9 26.0 27.1 100.0
IADL dependency 89.6 40.2 25.8 34.0 100.0
ADL dependency 99.6 17.9 18.9 63.3 100.0
Total 70.7 46.6 26.0 27.3 100.0
Initial state After 15 years
No dependency 83.3 34.3 28.3 37.4 100.0
IADL dependency 95.4 32.4 27.8 39.7 100.0
ADL dependency 99.9 23.7 23.6 52.7 100.0
Total 85.6 34.2 28.3 37.5 100.0
Note that the initial state in terms of dependency at age 78 has a profound influence
on probability of death—especially in the short run. Also, as should be expected, the
expected degree of dependency among the survivors is strongly dependent on the
initial state. In both Japan and Sweden, there is a probability of recovery. After 15
years, very few who were initially dependent survive.
In Tables 3 and 4, LTC-level transitions (including death) are shown over time
for women from the initial level of age 78 in the Japanese and Swedish cases. The
corresponding results for men (not shown here) follow a similar pattern, though a
smaller proportion of men than women end up in institutional care.
84 International Journal of Population Studies 2017, Volume 3, Issue 1