Page 92 - IJPS-3-1
P. 92

Modeling trajectories of long-term care needs at old age: A Japanese-Swedish comparison

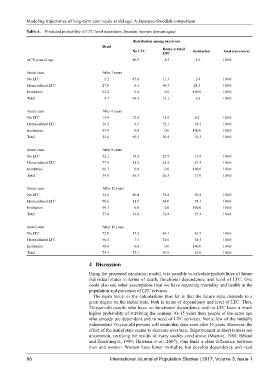
            Table 4.  Predicted probability of LTC level transitions, Sweden, women (percentages)
                                                          Distribution among survivors
                                             Dead
                                                          No LTC      Home-related   Institution  Total (survivors)
                                                                      LTC
             at 78 years of age                           86.9          8.5           4.6       100.0


             Initial state                   After 3 years
             No LTC                            5.2        85.8        11.3            2.9       100.0
             Home-related LTC                27.0           6.1       69.3          24.5        100.0
             Institution                     62.2           0.0         0.0        100.0        100.0
             Total                             9.7        69.3        15.1            6.3       100.0


             Initial state                   After 6 years
             No LTC                          15.9         72.9        18.9           8.2        100.0
             Home-related LTC                56.2           9.5       52.1           38.5       100.0
             Institution                     87.9           0.0         0.0        100.0        100.0
             Total                           22.6         69.3        20.4           10.3       100.0

             Initial state                   After 9 years
             No LTC                          32.1         58.3        25.9           15.8       100.0
             Home-related LTC                77.9         11.4        41.2           47.5       100.0
             Institution                     96.7           0.0         0.0        100.0        100.0
             Total                           39.0         56.7        26.3           17.0       100.0

             Initial state                   After 12 years
             No LTC                          52.4         40.4        32.8           26.8       100.0
             Home-related LTC                90.6         11.9        34.0           54.1       100.0
             Institution                     99.3           0.0         0.0        100.0        100.0
             Total                           57.8         39.8        32.8           27.4       100.0


             Initial state                   After 15 years
             No LTC                          72.0         17.2        40.1           42.7       100.0
             Home-related LTC                96.4           7.5       31.0           61.5       100.0
             Institution                     99.8           0.0         0.0        100.0        100.0
             Total                           75.3         17.1        39.9           43.0       100.0

                                       4  Discussion

                                       Using the presented simulation model, it is possible to calculate probabilities of future
                                       individual states in terms of death, functional dependency, and level of LTC. One
                                       could also use other assumptions than we have regarding mortality and health in the
                                       population and provision of LTC services.
                                         The main result of the calculations thus far is that the future state depends to a
                                       great degree on the initial state, both in terms of dependency and level of LTC. Thus,
                                       78-year-old people who have no functional dependency and no LTC have a much
                                       higher probability of surviving the coming 10–15 years than people of the same age
                                       who already are dependent and in need of LTC services. Not a few of the initially
                                       independent 78-year-old persons will retain that state even after 15 years. However, the
                                       effect of the initial state seems to decrease over time. Improvement in short term is not
                                       uncommon, verifying the results of many studies cited above (Manton, 1988; Béland
                                       and Zunzunegui, 1999; Holstein et al., 2007), One finds a clear difference between
                                       men and women. Women have lower mortality, but develop dependency and need

            86                                  International Journal of Population Studies   2017, Volume 3, Issue 1
   87   88   89   90   91   92   93   94   95   96   97