Page 91 - IJPS-3-1
P. 91

Lagergen M, Kurube N and Saito Y


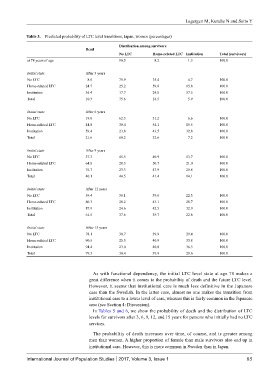
            Table 3.  Predicted probability of LTC level transitions, Japan, women (percentages)

                                                    Distribution among survivors
                                      Dead
                                                    No LTC        Home-related LTC Institution  Total (survivors)
             at 78 years of age                     90.5            8.2           1.3          100.0


             Initial state            After 3 years
             No LTC                     8.6         79.9          15.4            4.7          100.0
             Home-related LTC         24.7          25.2          59.0          15.8           100.0
             Institution              36.4          17.7          24.8          57.5           100.0
             Total                    10.3          75.6          18.5            5.9          100.0

             Initial state            After 6 years
             No LTC                   19.0          62.3          31.2            6.6          100.0
             Home-related LTC         44.8          30.4          54.1          15.5           100.0
             Institution              59.4          23.8          43.5          32.8           100.0
             Total                    21.6          60.2          32.6            7.2          100.0

             Initial state            After 9 years
             No LTC                   37.3          45.5          40.9          13.7           100.0
             Home-related LTC         64.8          28.3          50.7          21.0           100.0
             Institution              76.7          23.3          47.9          28.8           100.0
             Total                    40.1          44.5          41.4          14.1           100.0


             Initial state            After 12 years
             No LTC                   59.4          38.1          39.6          22.3           100.0
             Home-related LTC         80.3          28.2          43.1          28.7           100.0
             Institution              87.9          24.6          42.5          32.9           100.0
             Total                    61.5          37.6          39.7          22.6           100.0


             Initial state            After 15 years
             No LTC                   78.1          30.7          39.9          29.4           100.0
             Home-related LTC         90.5          25.3          40.9          33.8           100.0
             Institution              94.4          23.0          40.8          36.3           100.0
             Total                    79.3          30.4          39.9          29.6           100.0


                                         As with functional dependency, the initial LTC level state at age 78 makes a
                                       great difference when it comes to the probability of death and the future LTC level.
                                       However, it seems that institutional care is much less definitive in the Japanese
                                       case than the Swedish. In the latter case, almost no one makes the transition from
                                       institutional care to a lower level of care, whereas this is fairly common in the Japanese
                                       case (see Section 4: Discussion).
                                         In Tables 5 and 6, we show the probability of death and the distribution of LTC
                                       levels for survivors after 3, 6, 9, 12, and 15 years for persons who initially had no LTC
                                       services.

                                         The probability of death increases over time, of course, and is greater among
                                       men than women. A higher proportion of female than male survivors also end up in
                                       institutional care. However, this is more common in Sweden than in Japan.

            International Journal of Population Studies   2017, Volume 3, Issue 1                             85
   86   87   88   89   90   91   92   93   94   95   96