
Page 93 - IJPS-3-1
P. 93
Lagergen M, Kurube N and Saito Y
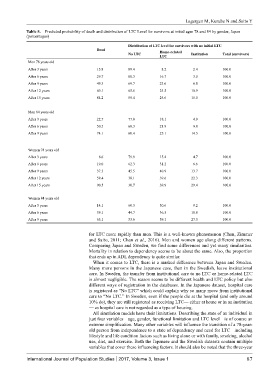
Table 5. Predicted probability of death and distribution of LTC Level for survivors at initial ages 78 and 84 by gender, Japan
(percentages)
Distribution of LTC level for survivors with no initial LTC
Dead
No LTC Home-related Institution Total (survivors)
LTC
Men 78 years old
After 3 years 15.8 89.4 8.2 2.4 100.0
After 6 years 29.7 80.3 16.7 3.0 100.0
After 9 years 49.3 69.7 23.6 6.8 100.0
After 12 years 69.1 65.6 23.5 10.9 100.0
After 15 years 84.2 59.4 25.6 15.0 100.0
Men 84 years old
After 3 years 22.7 77.0 18.1 4.9 100.0
After 6 years 50.5 68.3 21.9 9.8 100.0
After 9 years 74.1 60.4 25.1 14.5 100.0
Women 78 years old
After 3 years 8.6 79.9 15.4 4.7 100.0
After 6 years 19.0 62.3 31.2 6.6 100.0
After 9 years 37.3 45.5 40.9 13.7 100.0
After 12 years 59.4 38.1 39.6 22.3 100.0
After 15 years 90.5 30.7 39.9 29.4 100.0
Women 84 years old
After 3 years 14.1 60.3 30.6 9.2 100.0
After 6 years 39.1 44.7 36.5 18.8 100.0
After 9 years 65.1 33.6 39.1 27.3 100.0
for LTC more rapidly than men. This is a well-known phenomenon (Chan, Zimmer
and Saito, 2011; Chan et al., 2016). Men and women age along different patterns.
Comparing Japan and Sweden, we find some differences and yet many similarities.
Mortality in relation to dependency seems to be about the same. Also, the proportion
that ends up in ADL dependency is quite similar.
When it comes to LTC, there is a marked difference between Japan and Sweden.
Many more persons in the Japanese case, than in the Swedish, leave institutional
care. In Sweden, the transfer from institutional care to no LTC or home-related LTC
is almost negligible. The reason seems to be different health and LTC policy but also
different ways of registration in the databases. In the Japanese dataset, hospital care
is registered as “No LTC” which could explain why so many move from institutional
care to “No LTC.” In Sweden, even if the people die at the hospital (and only around
10% do), they are still registered as receiving LTC— either at home or in an institution
— as hospital care is not regarded as a type of housing.
All simulation models have their limitations. Describing the state of an individual in
just four variables—age, gender, functional limitation and LTC level—is of course an
extreme simplification. Many other variables will influence the transition of a 78-year-
old person from independence to a state of dependency and need for LTC—including
lifestyle and life condition factors such as living alone or with family, smoking, alcohol
use, diet, and exercise. Both the Japanese and the Swedish datasets contain multiple
variables that cover these influencing factors. It should also be noted that the three-year
International Journal of Population Studies 2017, Volume 3, Issue 1 87