Page 89 - IJPS-3-1
P. 89

Lagergen M, Kurube N and Saito Y

                                         The cumulative transition-probability matrices were used to calculate the resulting
                                       distribution of states by successive age given the initial state.

                                       3  Results
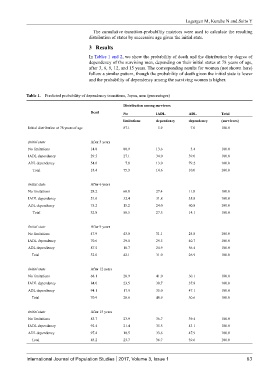
                                       In Tables 1 and 2, we show the probability of death and the distribution by degree of
                                       dependency of the surviving men, depending on their initial states at 78 years of age,
                                       after 3, 6, 9, 12, and 15 years. The corresponding results for women (not shown here)
                                       follow a similar pattern, though the probability of death given the initial state is lower
                                       and the probability of dependency among the surviving women is higher.


            Table 1.  Predicted probability of dependency transitions, Japan, men (percentages)
                                                      Distribution among survivors
                                        Dead          No            IADL          ADL          Total
                                                      limitations   dependency    dependency   (survivors)
             Initial distribution at 78 years of age  87.1            5.9           7.0        100.0


             Initial state              After 3 years
             No limitations             14.8          80.9          13.6            5.4        100.0
             IADL dependency            29.5          27.1          34.0          39.0         100.0
             ADL dependency             54.6            7.8         13.0          79.2         100.0
                  Total                 18.4          75.3          14.6          10.0         100.0


             Initial state              After 6 years
             No limitations             28.2          60.8          27.4          11.8         100.0
             IADL dependency            51.6          32.4          31.8          35.8         100.0
             ADL dependency             75.2          15.2          24.0          60.8         100.0
                  Total                 32.8          58.5          27.5          14.1         100.0


             Initial state              After 9 years
             No limitations             47.9          43.0          31.1          25.8         100.0
             IADL dependency            70.6          29.8          29.5          40.7         100.0
             ADL dependency             87.5          18.7          24.9          56.4         100.0
                 Total                  52.0          42.1          31.0          26.9         100.0


             Initial state              After 12 years
             No limitations             68.1          28.9          41.0          30.1         100.0
             IADL dependency            84.0          23.5          38.7          37.8         100.0
             ADL dependency             94.1          17.9          35.0          47.1         100.0
                 Total                  70.9          28.6          40.9          30.6         100.0


             Initial state              After 15 years
             No limitations             83.7          23.9          36.7          39.4         100.0
             IADL dependency            92.4          21.4          35.5          43.1         100.0
             ADL dependency             97.4          18.5          33.6          47.9         100.0
                 Total                  85.2          23.7          36.7          39.6         100.0


            International Journal of Population Studies   2017, Volume 3, Issue 1                             83
   84   85   86   87   88   89   90   91   92   93   94