
Page 14 - IJPS-3-2
P. 14
Household structure and child education in Cambodia
employment of all previously or currently employed parents. We created five employment sectors, namely farming
(including fishing, hunting, forestry, and plantation), crafts, industry, civil service, and white-collar or service jobs. All
individuals employed in farming or crafts were also asked whether they owned the land or resources needed for their
activity (e.g., boat for fishing, loom for weaving, etc.). We created four categories for property: ownership, renting in
exchange of payment, free usage (e.g., lending by kin), or being a laborer.
3. Results
3.1 School Enrollment
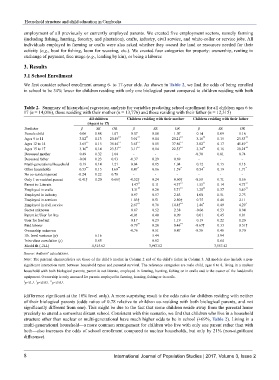
We first consider school enrollment among 6- to 17-year olds. As shown in Table 2, we find the odds of being enrolled
in school to be 34% lower for children residing with only one biological parent compared to children residing with both
Table 2. Summary of hierarchical regression analysis for variables predicting school enrollment for all children ages 6 to
17 (n = 14,016), those residing with their mother (n = 13,776) and those residing with their father (n = 12,315)
All children Children residing with their mother Children residing with their father
(Ages 6 to 17)
Predictor β SE OR β SE OR β SE OR
Female child 0.06 0.08 1.07 0.07 0.08 1.07 0.14 0.09 1.16
Ages 9 to 11 3.02 ** 0.13 20.49 ** 3.01 ** 0.14 20.21 ** 3.16 ** 0.15 23.53 **
Ages 12 to 14 3.65 ** 0.15 38.46 ** 3.63 ** 0.15 37.86 ** 3.82 ** 0.17 45.49 **
Ages 15 to 17 3.16 ** 0.14 23.51 ** 3.11 ** 0.14 22.53 ** 3.34 ** 0.16 28.21 **
Deceased mother 0.49 0.32 1.64 - - - -0.30 0.81 0.74
Deceased father -0.08 0.23 0.93 -0.37 0.29 0.69 - - -
Multi-generational household 0.19 0.14 1.21 0.04 0.15 1.04 0.12 0.15 1.13
Other households 0.53 ** 0.15 1.69 ** 0.47 * 0.16 1.59 * 0.54 * 0.19 1.71 *
No co-resident parent -0.24 0.22 0.78 - - - - - -
Only 1 co-resident parent -0.41† 0.20 0.66† -0.52† 0.24 0.60† -0.58 0.71 0.56
Parent is: Literate 1.47 ** 0.11 4.37 ** 1.55 ** 0.14 4.73 **
Employed in crafts 1.31 ** 0.20 3.71 ** 1.25 ** 0.37 3.49 **
Employed in industry 0.97 0.57 2.63 1.00 0.51 2.73
Employed in services 1.03† 0.51 2.80† 0.75 0.46 2.11
Employed in civil service 2.67 ** 0.76 14.45 ** 1.46 * 0.49 4.29 *
Sector unknown 0.87 0.52 2.38 -0.06 0.53 0.94
Parent is: User for free -0.01 0.40 0.99 0.01 0.45 1.01
User for fee/rent 0.17 0.23 1.19 0.19 0.22 1.20
Paid laborer -0.79 ** 0.20 0.46 ** -0.67† 0.33 0.51†
Ownership unknown -0.76 0.51 0.47 -0.36 0.46 0.70
Hh. level variance (ψ) 6.16 5.44 5.94
Intra-class correlation (ρ) 0.65 0.62 0.64
Model fit (-2LL) 4,515.62 3,987.02 3,557.42
Source: Authors’ calculations.
Note: The parental characteristics are those of the child’s mother in Column 2 and of the child’s father in Column 3. All models also include a non-
significant interaction term between household types and parental survival. The reference categories are male child, ages 6 to 8, living in a nuclear
household with both biological parents, parent is not literate, employed in farming, hunting, fishing or in crafts and is the owner of the land/crafts
equipment. Ownership is only assessed for parents employed in farming, hunting, fishing or in crafts.
† p<0.1. p<0.05. p<0.01.
**
*
(difference significant at the 10% level only). A more surprising result is the odds ratio for children residing with neither
of their biological parents (odds ratios of 0.78 relative to children co-residing with both biological parents, and not
significantly different from one). This might be due to the fact that some children reside away from the parental home
precisely to attend a somewhat distant school. Consistent with this scenario, we find that children who live in a household
structure other than nuclear or multi-generational have much higher odds to be in school (+69%, Table 2). Living in a
multi-generational household—a more common arrangement for children who live with only one parent rather than with
both—also increases the odds of school enrollment compared to nuclear households, but only by 21% (non-significant
difference).
8 International Journal of Population Studies | 2017, Volume 3, Issue 2