
Page 16 - IJPS-3-2
P. 16
Household structure and child education in Cambodia
below on average). However, we again find that these effects might be counter-balanced by residing in a non-nuclear
household structure. Living in a multi-generational household raises the expected grade by 0.16 and the expected increase
is even higher—0.25 of a grade—when living in another type of non-nuclear household structure (i.e., Other households
type). Combining the estimated effects of parental absence and of living in a non-nuclear household, children residing
with only one parent in these household structures are expected to be very nearly in the same grade on average as children
residing with both parents in a nuclear household.
Once we control for the characteristics of the resident parent for children living with at least one of their parents, we
see the same pattern as with school attendance. For children residing with their biological mother, the estimates are very
similar to those of the previous model (0.24-grade difference between those who also reside with their father and those
who do not). For children residing with a biological father, the difference is much more substantial, more than half a
grade (0.53-grade difference between those who also reside with their mother and those who do not), albeit significant
only at the 10% level due to the small number of children not living with their mother. As in the school-attendance
models, the effects of household structures are attenuated by the inclusion of parental characteristics. The coefficients for
multi-generational household structures hardly change though, while the coefficients for other household structures are
reduced in half. (Again, coefficients in the model with co-resident fathers are only significant at the 10% level). Adding
the characteristics of the resident parent, we now find that children residing with only one of their parent in a multi-
generational household are in lower grade on average that those residing with both parents in a nuclear-family household,
especially if the absent parent is the mother.
The literacy of the co-resident parent has equally strong positive effects on the child’s grade-for-age in the models
with mother present and in those with father present. We also observe strong positive effects of the resident parent’s
occupation. As with school-attendance models, children whose parents are engaged in crafts or civil service fare better
that those whose parents are employed in the agricultural sector. As in those models, children whose fathers are paid
laborers also fare worse, but we no longer observe the same disadvantage for children whose mothers are paid laborers.
Another notable difference with the school-attendance models is that we now find a gender difference in grade for age,
with girls being about a quarter of a grade above same-age boys across the three models. Overall, we also confirm how
common grade repetition is in Cambodia, with 9 to 11 year-olds being on average one year below their expected grade
compared to 6 to 8 year-olds, and 12 to 14 year-olds being an additional year below their expected grade. In other words,
the average child only moves up two grades every three years.
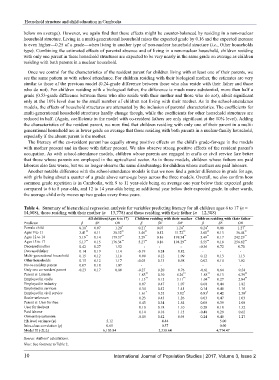
Table 4. Summary of hierarchical regression analysis for variables predicting literacy for all children ages 6 to 17 (n =
14,008), those residing with their mother (n = 13,778) and those residing with their father (n = 12,308)
All children(Ages 6 to 17) Children residing with their mother Children residing with their father
Predictor β SE OR β SE OR β SE OR
Female child 0.18 * 0.07 1.20 * 0.21 * 0.07 1.24 * 0.24 * 0.08 1.27 *
Ages 9 to 11 3.41 ** 0.11 30.32 ** 3.46 ** 0.12 31.72 ** 3.60 ** 0.13 36.44 **
Ages 12 to 14 5.19 ** 0.14 179.37 ** 5.29 ** 0.16 198.34 ** 5.49 ** 0.17 242.29 **
Ages 15 to 17 5.17 ** 0.15 176.34 ** 5.27 ** 0.16 194.29 ** 5.55 ** 0.18 256.82 **
Deceased mother 0.42 0.27 1.52 - - - -0.36 0.72 0.70
Deceased father 0.14 0.19 1.14 -0.19 0.24 0.82 - - -
Multi-generational household 0.15 0.12 1.16 0.09 0.12 1.09 0.12 0.13 1.13
Other households 0.15 0.12 1.17 -0.03 0.13 0.98 0.02 0.14 1.02
No co-resident parent 0.07 0.18 1.07 - - - - - -
Only one co-resident parent -0.23 0.17 0.80 -0.27 0.20 0.76 -0.61 0.64 0.54
Parent is: Literate 1.83 ** 0.10 6.26 ** 1.85 ** 0.13 6.39 **
Employed in crafts 1.13 ** 0.15 3.11 ** 1.04 ** 0.27 2.84 **
Employed in industry 0.07 0.47 1.07 0.60 0.44 1.82
Employed in services 0.34 0.42 1.41 0.14 0.40 1.16
Employed in civil service 1.61 * 0.55 5.02 * 0.83 † 0.42 2.30 †
Sector unknown 0.23 0.43 1.26 0.03 0.47 1.03
Parent is: User for free 0.43 0.34 1.54 0.08 0.39 1.08
User for fee/rent 0.10 0.18 1.10 0.28 0.18 1.32
Paid laborer 0.14 0.18 1.15 -0.48 0.29 0.62
Ownership unknown -0.05 0.42 0.95 0.24 0.40 1.27
Hh level variance (ψ) 5.12 4.44 5.00
Intra-class correlation (ρ) 0.61 0.57 0.60
Model fit (-2LL) 6,103.84 5,330.64 4,774.47
Source: Authors’ calculations.
Note: See footnote to Table 2.
10 International Journal of Population Studies | 2017, Volume 3, Issue 2